Multi-Point Marine Temperature Monitoring: DS18B20 Sensor Arrays for Depth Profiling
DATE: 2026.07.22 AUTHOR: Marine Monitoring Team VIEWS: 2,600+ Marine Monitoring DS18B20 Temperature Profiling Depth Profiling Ocean Temperature
How to build a multi-point marine temperature monitoring system using DS18B20 sensors for depth profiling, thermal stratification analysis, and long-term data logging
Temperature is a fundamental parameter in marine science, influencing ocean currents, marine life distribution, weather patterns, and climate change. Understanding temperature variations at different water depths is critical for research, aquaculture, environmental monitoring, and climate studies. The DS18B20 digital temperature sensor offers a cost-effective, accurate, and scalable solution for multi-point temperature monitoring in marine environments.
1. Why Marine Temperature Monitoring Matters
-
Climate Research: Ocean temperature data is essential for understanding global warming and climate patterns
-
Marine Biology: Temperature affects the distribution, reproduction, and migration of marine species
-
Aquaculture: Optimal temperature ranges are critical for fish and shellfish farming
-
Shipping & Navigation: Temperature affects water density, which impacts ship stability
-
Thermal Stratification: Temperature differences between water layers affect nutrient cycling and oxygen distribution
-
Early Warning: Temperature anomalies can indicate pollution events (thermal pollution) or oceanographic changes
Key Insight: A single temperature measurement at the surface is insufficient. Temperature can vary by several degrees Celsius over just a few meters of depth, especially in coastal areas and during summer months. Multi-point depth profiling is essential for comprehensive understanding.
2. DS18B20 Digital Temperature Sensor Overview
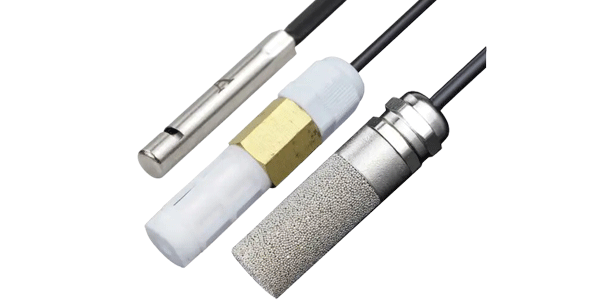
The DS18B20 is a 1-Wire digital temperature sensor manufactured by Maxim Integrated (now Analog Devices). It is widely used in environmental monitoring due to its accuracy, low cost, and ease of use.
|
Feature
|
Specification
|
|
Measurement Range
|
-55°C to +125°C
|
|
Accuracy
|
±0.5°C (-10°C to +85°C)
|
|
Resolution
|
9-bit to 12-bit (configurable, 0.0625°C at 12-bit)
|
|
Communication
|
1-Wire protocol (single bus for multiple sensors)
|
|
Power
|
3.0V to 5.5V
|
|
Package
|
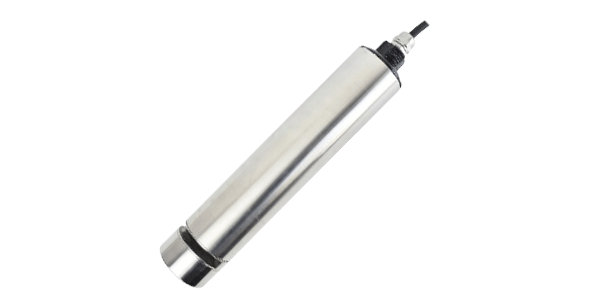
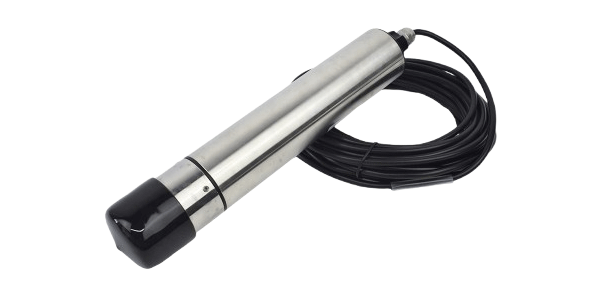
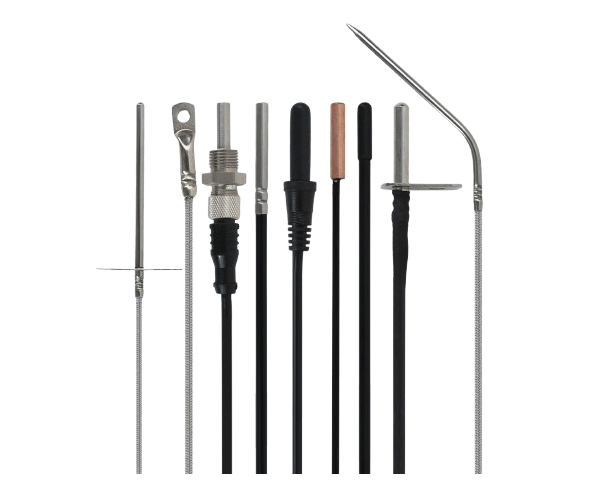
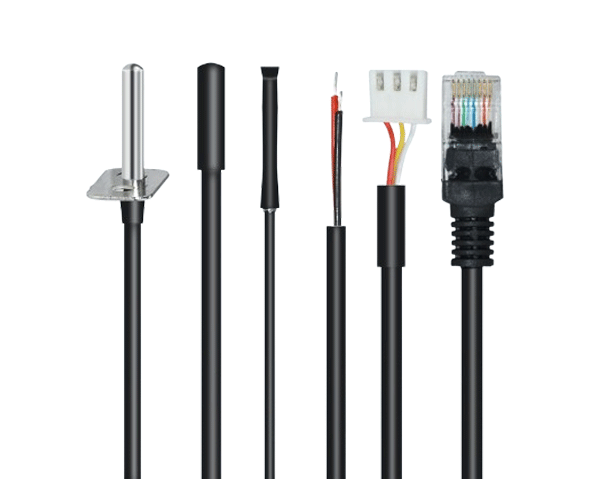
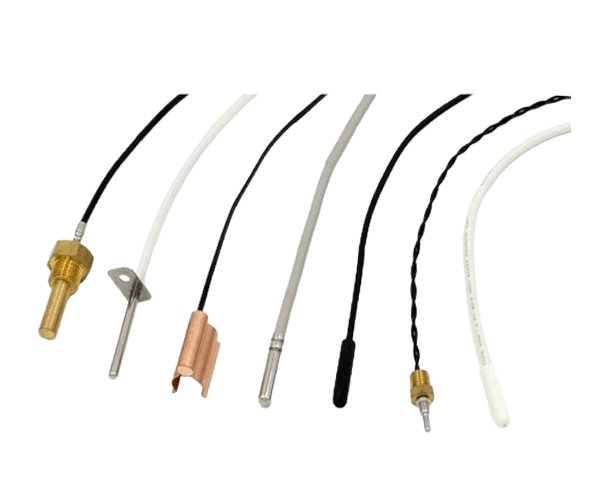
TO-92, SOIC, or waterproof probe version (epoxy, stainless steel)
|
|
Unique ID
|
Each sensor has a factory-programmed 64-bit serial number
|
|
Advantage
|
Multiple sensors can share one data line (1-Wire bus)
|
Key Advantages
Why DS18B20 for Marine Monitoring
-
Low cost: ~$2-5 per sensor, enabling dense multi-point arrays
-
Digital output: No analog-to-digital conversion needed
-
Long cable lengths: Can be run up to 100m with proper wiring
-
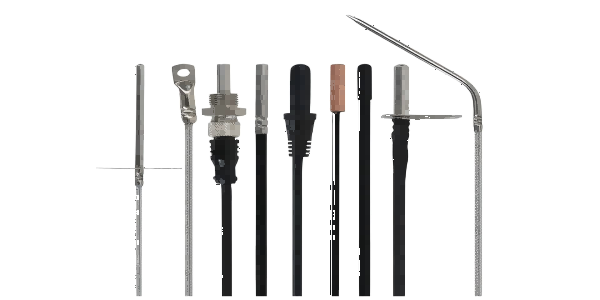
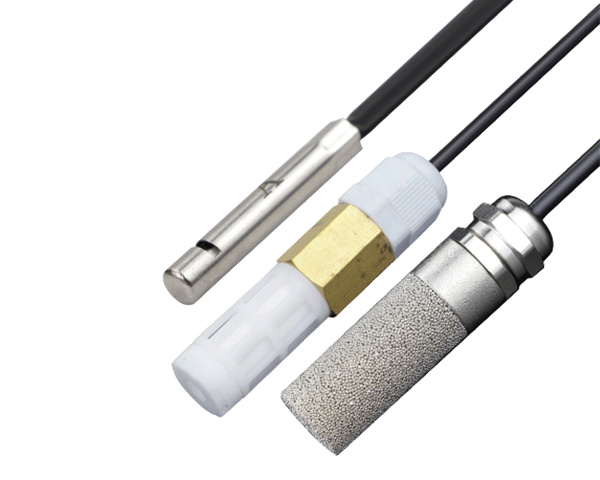
Waterproof variants: Available in stainless steel probes for underwater use
-
Pre-calibrated: Factory calibrated, no user calibration required
Limitations
Considerations
-
Slower response: 750ms max conversion time (12-bit)
-
Not suited for extreme depths: Probe seals may fail at >100m
-
1-Wire bus challenges: Bus length and device count limitations
-
Corrosion: Stainless steel probes resist corrosion, but connectors must be sealed
3. Multi-Point Marine Temperature Monitoring System Architecture
3.1 System Components
-
Sensor Array: Multiple DS18B20 sensors in waterproof stainless steel probes, spaced at different depths
-
Data Logger/Controller: Arduino-based, Raspberry Pi, or industrial PLC with 1-Wire interface
-
Real-Time Clock (RTC): For timestamping data
-
Data Storage: SD card, internal flash, or cloud transmission
-
Telemetry: 4G/5G, LoRa, or satellite for remote data transmission
-
Power Supply: Solar panel with battery backup (for remote deployments)
-
Enclosure: Waterproof housing (IP66/67) for electronics
3.2 Sensor Depth Placement Strategy
The number and placement of sensors depend on the research objectives and water body characteristics:
|
Depth
|
Purpose
|
Typical Sensor Spacing
|
|
Surface (0-1m)
|
Air-water interface temperature, solar heating
|
0.5m intervals
|
|
Epilimnion (1-10m)
|
Warm surface layer (stratification)
|
2m intervals
|
|
Thermocline (10-30m)
|
Rapid temperature change zone
|
1m intervals (higher resolution)
|
|
Hypolimnion (30m+)
|
Cold bottom water
|
5m intervals
|
Pro Tip: Use a greater sensor density (closer spacing) in the thermocline zone where temperature changes most rapidly. This provides accurate resolution of the thermal gradient.
4. Wiring & Code Examples
4.1 Wiring Diagram
1-Wire Bus Connections:
-
VDD (Red): 3.3V or 5V power supply
-
GND (Black): Common ground
-
DQ (Yellow/White): Data line with 4.7kΩ pull-up resistor to VDD
Bus Wiring: Connect all sensors in parallel (same VDD, GND, and DQ lines). Use a 4.7kΩ pull-up resistor between DQ and VDD. For long cables (>10m), use a lower resistor value (e.g., 2.2kΩ) to maintain signal integrity.
4.2 Arduino Code Example (Basic Scan)
#include <OneWire.h>
#include <DallasTemperature.h>

#define ONE_WIRE_BUS 2  // Data pin

OneWire oneWire(ONE_WIRE_BUS);
DallasTemperature sensors(&oneWire);

void setup() {
  Serial.begin(9600);
  sensors.begin();
  Serial.println("Marine Temperature Profiling System");
  Serial.println("Scanning for DS18B20 sensors...");
  Serial.print("Number of sensors found: ");
  Serial.println(sensors.getDeviceCount());
}

void loop() {
  sensors.requestTemperatures();
  Serial.print("Depth Profile: ");
  for (int i = 0; i < sensors.getDeviceCount(); i++) { float temp = sensors.getTempCByIndex(i); Serial.print(temp); Serial.print("°C "); } Serial.println(); delay(5000); // 5-second interval }
4.3 Reading Temperatures with Depth Labels
To associate each sensor with a specific depth, store the device addresses in an array and assign depth labels (e.g., 0m, 2m, 5m, 10m, 20m, 30m).
5. Temperature Profile Analysis
Temperature profiles reveal critical oceanographic and limnological patterns: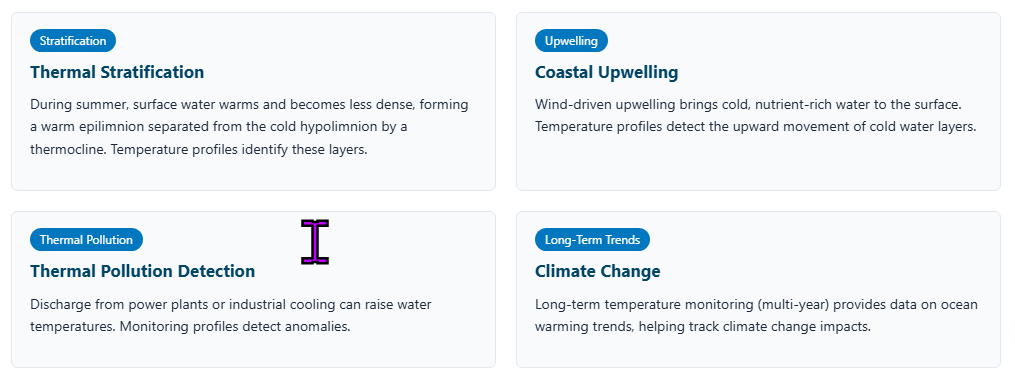
6. Data Logging & Visualization
6.1 Data Logging Options
-
SD Card: Log data to a microSD card in CSV format for offline analysis
-
Cloud Storage: Send data to AWS, Azure, or Thingspeak for cloud storage and visualization
-
Local Display: Use an LCD or OLED display for real-time readings at the monitoring station
-
Remote Telemetry: Transmit data via 4G, LoRaWAN, or satellite to a central database
6.2 Visualization Techniques
-
Time series graphs: Display temperature changes over time at each depth
-
Depth profiles: Plot temperature vs. depth to show vertical structure
-
Heatmaps: Show temperature distribution over time and depth (isotherm plots)
-
Animated profiles: Time-lapse animations to visualize stratification and mixing events
7. Deployment & Maintenance
7.1 Mounting the Sensor Array
-
Buoy-mounted: Sensors suspended at different depths from a buoy
-
Mooring Line: Sensors attached to a cable anchored to the seabed
-
Fixed Platform: Sensors mounted on a pier, jetty, or offshore platform
-
Bottom-resting: Sensors placed on the seabed with vertical cables
7.2 Maintenance Schedule
|
Task
|
Frequency
|
Notes
|
|
Inspect connectors for corrosion
|
Monthly (coastal) / Quarterly (open ocean)
|
Seal with dielectric grease
|
|
Check cable integrity
|
Monthly
|
Look for damage from marine growth, fishing gear
|
|
Verify sensor accuracy
|
Bi-annually
|
Compare with calibrated reference thermometer
|
|
Clean sensor probes
|
Quarterly
|
Remove biofouling (marine growth)
|
|
Check data transmission
|
Weekly
|
Verify telemetry is functioning
|
|
Calibrate (if necessary)
|
Annually
|
DS18B20s are pre-calibrated; verification sufficient
|
Maintenance Tip: Biofouling (marine growth) is a major challenge. Use anti-fouling coatings on sensor probes and cables. Schedule regular cleaning dives or use self-cleaning sensor designs.
8. Real-World Applications
8.1 Aquaculture Farm Monitoring
Fish farms require optimal temperature ranges for growth and health. Multi-point temperature monitoring detects thermal stratification that can lead to low oxygen conditions. Early warning allows farmers to adjust aeration or feeding schedules.
8.2 Oceanographic Research
Research vessels deploy multi-point temperature arrays (CTD systems) to study ocean circulation, mixing, and climate change. Low-cost DS18B20 arrays complement expensive CTD rosettes for shallow-water studies.
8.3 Coastal Environment Monitoring
Estuaries and coastal areas are highly sensitive to temperature changes. Multi-point monitoring detects pollution events (thermal or chemical) and tracks changes from coastal development.
8.4 Lake & Reservoir Studies
Thermal stratification in lakes affects oxygen distribution, nutrient cycling, and drinking water quality. Temperature profiles are essential for lake management.
9. Frequently Asked Questions
Q1: How many DS18B20 sensors can be connected to one data bus?
A: Up to 100 sensors can be connected on the same 1-Wire bus, but practical limits are around 30-50 sensors due to bus capacitance and signal integrity.
Q2: What is the maximum cable length for DS18B20 sensors?
A: Up to 100m for a single sensor and 30-50m for multiple sensors, depending on cable quality and bus capacitance. Use a shielded cable for longer runs.
Q3: Can DS18B20 sensors be submerged continuously in seawater?
A: Yes, when using waterproof stainless steel probe versions. Ensure the cable connectors are properly sealed and the probe body is rated for the intended depth.
Q4: How accurate are DS18B20 sensors?
A: ±0.5°C in the -10°C to +85°C range, which is sufficient for most marine monitoring applications. For higher accuracy, additional calibration can improve performance.
Q5: What is the response time of the DS18B20?
A: The sensor has a temperature conversion time of up to 750ms (12-bit resolution). The thermal response time (reaching 63% of final value) is typically 3-5 seconds in water, depending on the probe encapsulation.
10. Conclusion: Building a Robust Marine Temperature Monitoring System
Key Takeaways:
-
The DS18B20 sensor provides a cost-effective solution for multi-point marine temperature monitoring
-
Depth profiling is essential to understand thermal stratification and oceanographic patterns
-
Proper sensor placement, wiring, and data logging ensure reliable long-term data collection
-
Regular maintenance, including anti-fouling measures, extends system life
-
Data visualization (profiles, heatmaps) transforms raw data into actionable insights
Multi-point marine temperature monitoring using DS18B20 sensors is a proven, scalable, and economical solution for researchers, aquaculture operators, and environmental monitoring agencies. By building a custom depth profiling system, you can collect the high-resolution data needed to understand and protect our oceans.