Integrated River Monitoring Systems: Water Level, Flow & Quality Monitoring for Early Warning & Pollution Detection
DATE: 2026.07.21 AUTHOR: Environmental Monitoring Team VIEWS: 3,200+ River Monitoring Flood Early Warning Water Quality Pollution Detection Illegal Discharge
Real-time monitoring of water level, flow velocity, and water quality parameters (pH, turbidity, conductivity) to provide early warning of flood risks and pollution events, protect river ecosystems, and detect illegal discharges
Rivers are vital resources that supply drinking water, support ecosystems, and enable agriculture and industry. However, they face increasing threats from flooding and pollution. Integrated river monitoring systems that track water level, flow, and water quality in real-time provide the data needed to protect these critical resources. This article explores the components, applications, and benefits of comprehensive river monitoring systems.
1. Overview of Integrated River Monitoring Systems
An integrated river monitoring system combines multiple sensors and communication technologies to provide continuous, real-time data on:
-
Water Level & Flow: Monitor water level rise, velocity, and discharge to predict flood events
-
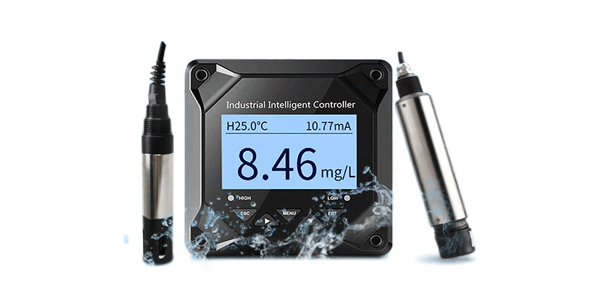
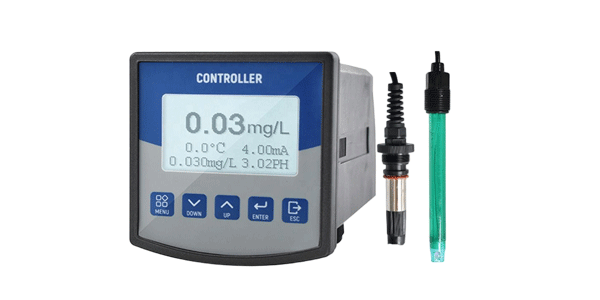
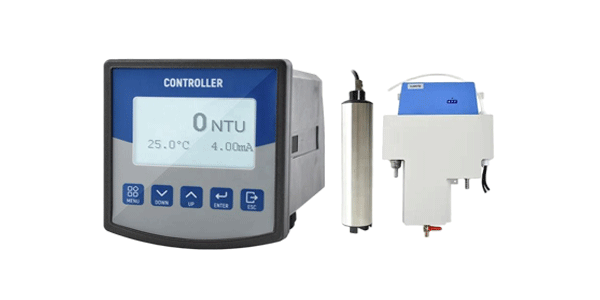
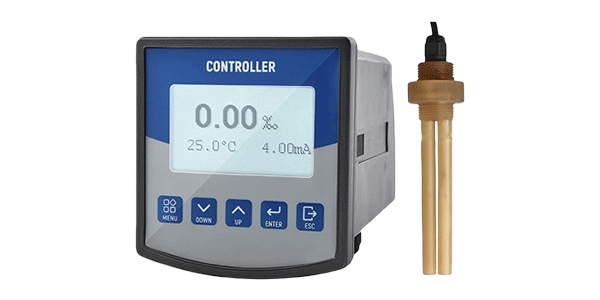
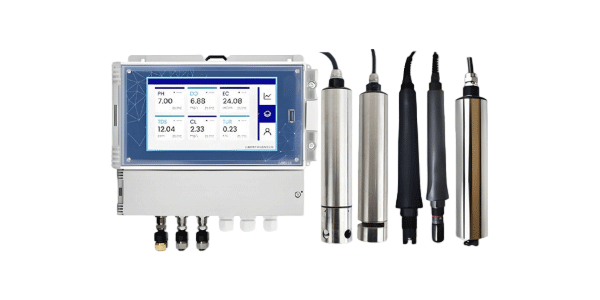
Water Quality: Measure pH, turbidity, conductivity, dissolved oxygen, and other parameters to detect pollution
-
Early Warning: Automated alerts when parameters exceed critical thresholds
-
Data Reporting: Centralized data collection and reporting to environmental agencies
Core Objective: To provide actionable intelligence for flood prevention, water quality protection, and enforcement against illegal discharges, ultimately safeguarding river ecosystems and communities.
2. Key Monitoring Parameters
2.1 Water Level & Flow
|
Parameter
|
Sensor Type
|
Purpose
|
Alert Threshold
|
|
Water Level
|
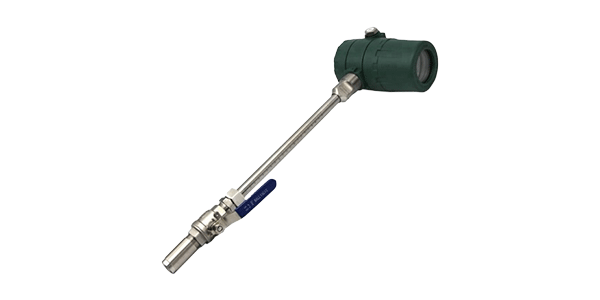
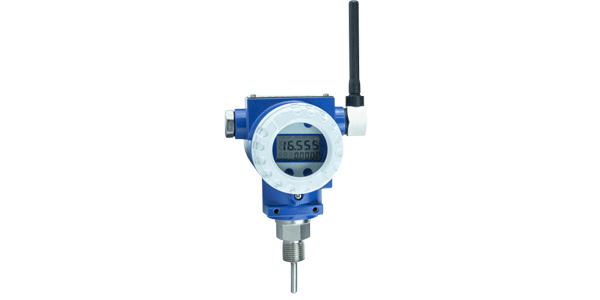
Radar, Ultrasonic, Pressure Transducer
|
Monitor rise and fall, detect flood conditions
|
Pre-defined warning and danger levels
|
|
Flow Velocity
|
Acoustic Doppler (ADCP), Doppler Radar
|
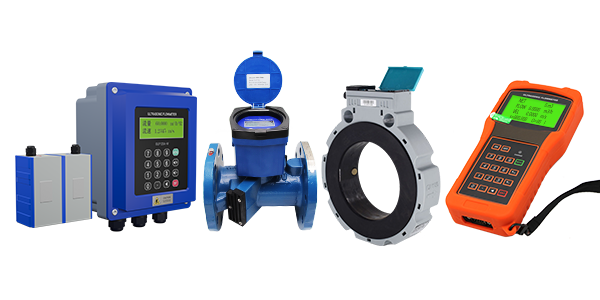
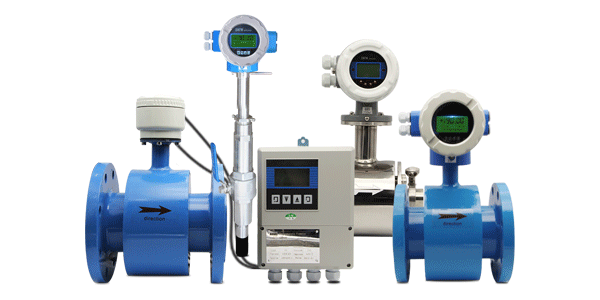
Measure current speed, calculate discharge
|
Abrupt changes indicating obstructions or breaches
|
|
Discharge Rate
|
Calculated from level and velocity
|
Predict flood flow volume
|
Threshold for flood alert
|
2.2 Water Quality Parameters
|
Parameter
|
Sensor Type
|
Purpose
|
Alert Threshold
|
|
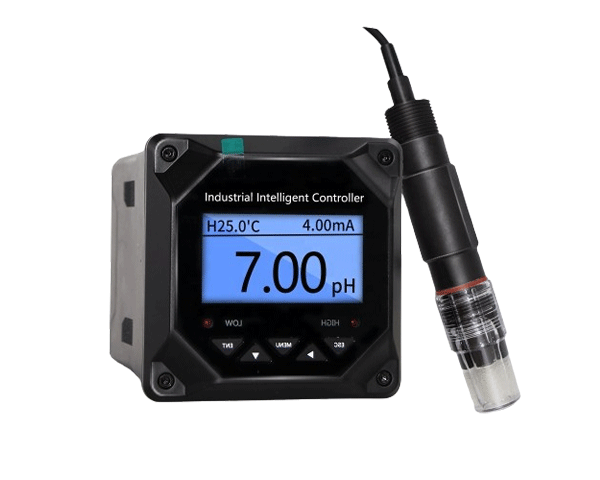
pH
|
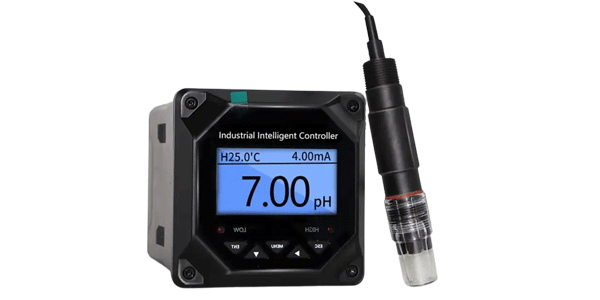
Glass Electrode (Digital)
|
Detect acid/base pollution, natural variation
|
< 6.5 or > 8.5 (typical)
|
|
Turbidity
|
90° Scattered Light (ISO 7027)
|
Detect sediment, runoff, or discharge events
|
> 5 NTU (drinking water) or site baseline
|
|
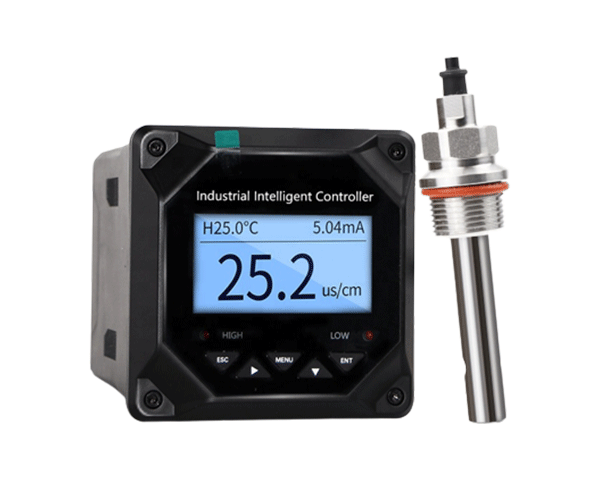
Conductivity
|
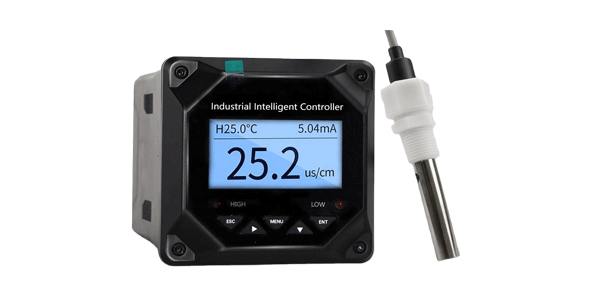
4-Electrode or Inductive
|
Detect dissolved solids from industrial discharge
|
> 20% above baseline
|
|
Dissolved Oxygen (DO)
|
Optical (Fluorescence)
|
Detect organic pollution, eutrophication
|
< 5 mg/L
|
|
Temperature
|
Thermistor
|
Track seasonal changes, detect thermal pollution
|
> 2°C above ambient baseline
|
3. System Architecture & Deployment
3.1 Typical Monitoring Station Components
-
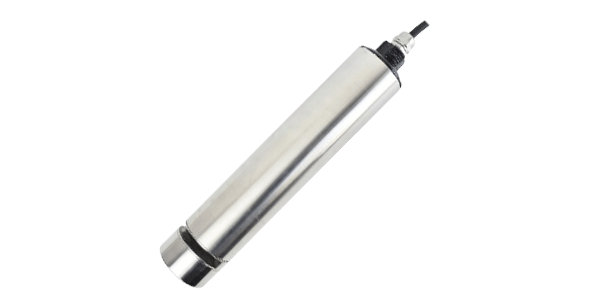
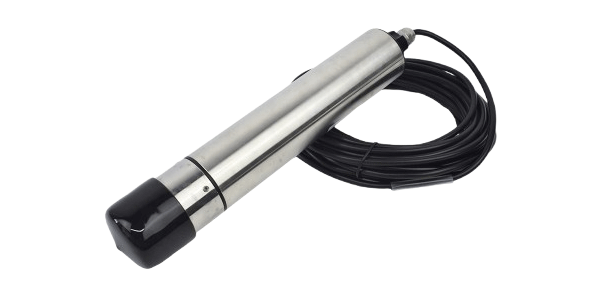
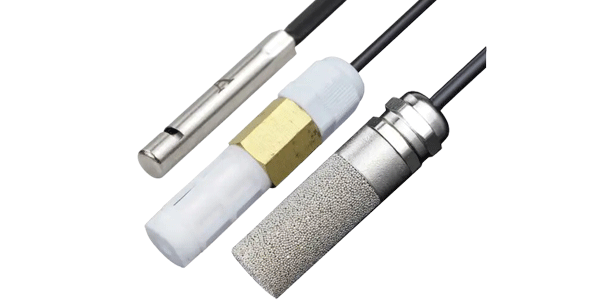
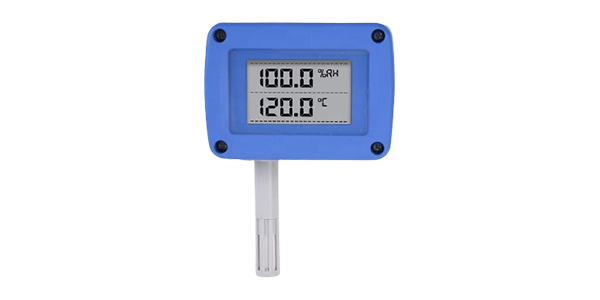
Sensors: Water level, flow, and water quality sensors installed at strategic locations
-
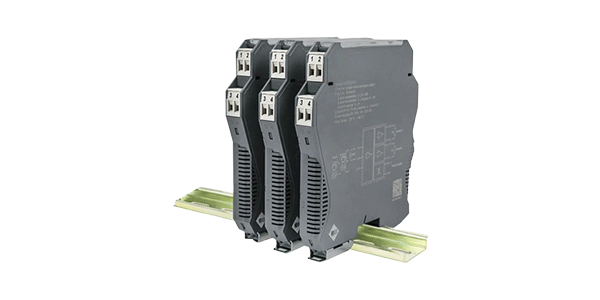
Data Logger: Local data acquisition and storage device
-
Telemetry: 4G/5G, LoRaWAN, or satellite communication for real-time data transmission
-
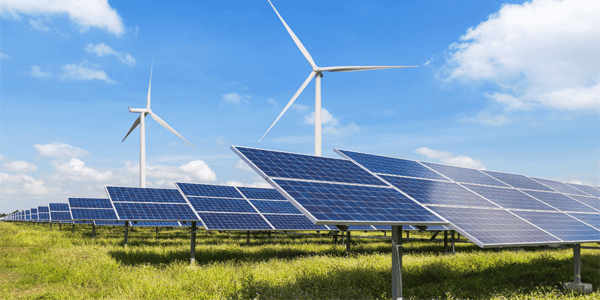
Power Supply: Solar panel with battery backup for remote locations
-
Environmental Enclosure: IP65 or IP67 rated housing for protection
Deployment Options
Fixed Stations
Permanent installations at bridges, weirs, or riverbanks. Ideal for long-term monitoring, regulatory compliance, and early warning systems.
Deployment Options
Mobile/Portable Units
Deployable units for temporary monitoring during flood events, construction, or suspected pollution incidents. Can be rapidly installed.
3.2 Data Flow & Reporting
-
Sensor Measurement: Continuous or interval-based measurements
-
Local Processing: Data logger stores and pre-processes data
-
Transmission: Real-time data sent to cloud or central server
-
Visualization: Dashboard displays real-time readings and trends
-
Alert Generation: Automated SMS, email, or app notifications when thresholds are exceeded
-
Reporting: Automated reports to environmental agencies and stakeholders
4. Flood Early Warning System
How it works: Continuous water level monitoring with real-time data transmission to a central system. When the water level approaches a pre-defined danger threshold, alerts are automatically triggered to downstream communities, emergency services, and river authorities.
-
Threshold 1 – Advisory: Water level reaches caution level; alert to monitoring team
-
Threshold 2 – Warning: Water level reaches flood alert level; notification to local authorities
-
Threshold 3 – Emergency: Water level exceeds danger level; immediate evacuation alerts to affected communities
5. Pollution Detection & Illegal Discharge Monitoring
How it works: Water quality sensors continuously measure pH, turbidity, conductivity, and other parameters. A sudden deviation from the baseline indicates a potential pollution event. Automated alerts notify environmental agencies, enabling rapid investigation and enforcement.
-
pH Excursion: A sharp drop or rise in pH can indicate acid/base discharges
-
Turbidity Spike: A sudden increase in turbidity may indicate sediment runoff or dredging
-
Conductivity Jump: A rapid rise in conductivity suggests dissolved solids from industrial discharges
-
DO Drop: A sudden decrease in dissolved oxygen indicates high organic pollution
-
Temperature Anomaly: A temperature increase may indicate thermal pollution from cooling water
Enforcement Support
Data for Regulatory Action
-
Timestamped data logs provide legal evidence
-
Trend analysis identifies repeat offenders
-
Data sharing with environmental agencies
-
Automated reporting for compliance monitoring
Ecosystem Protection
Protecting River Ecosystems
-
Early detection of pollution prevents fish kills
-
Maintains water quality for drinking water intakes
-
Supports biodiversity and habitat health
-
Provides long-term data for environmental impact assessments
6. Sensor & Equipment Selection
|
Equipment
|
Key Features
|
Recommended Brands / Types
|
|
Water Level Sensor
|
Non-contact radar or ultrasonic, high accuracy, low maintenance
|
Radar level sensors (for harsh conditions), Ultrasonic (cost-effective), Pressure transducer (submersible)
|
|
Flow Meter
|
Acoustic Doppler or radar-based, measures velocity and direction
|
Acoustic Doppler current profiler (ADCP), Doppler radar, or stage-discharge rating curves
|
|
pH Sensor
|
Digital (Modbus), double junction, PTFE junction for fouling resistance
|
METTLER TOLEDO, Hach, Endress+Hauser
|
|
Turbidity Sensor
|
ISO 7027 compliant, 90° scattered light, self-cleaning option
|
Hach, YSI, WTW
|
|
Conductivity Sensor
|
4-electrode or inductive, wide range, temperature compensation
|
METTLER TOLEDO, Hach, JUMO
|
|
Data Logger
|
Multi-channel, Modbus/4-20mA inputs, local storage, telemetry
|
Campbell Scientific, In-Situ, YSI
|
|
Telemetry
|
4G/5G cellular, LoRaWAN, or satellite for remote locations
|
Teltonika, Sierra Wireless, local IoT providers
|
|
Power Supply
|
Solar panel with battery backup, or mains power with UPS
|
Varies by site; solar recommended for remote stations
|
7. Case Studies
Case 1: Urban River Flood Early Warning System
A major city installed 15 river monitoring stations along a flood-prone river. Each station included water level sensors, flow meters, and telemetry. Real-time data was integrated into the city's emergency management system. In the second year, the system provided 4-6 hours of advance warning for a 100-year flood event, enabling timely evacuations and sandbagging, resulting in zero fatalities and $50 million in avoided damages.
Case 2: Industrial Pollution Detection & Enforcement
An environmental agency deployed water quality monitoring stations (pH, turbidity, conductivity, DO) downstream of an industrial zone. Within 3 months, the system detected a pH excursion (drop from 7.2 to 4.5) at 2:00 AM. Automated alerts were sent to the agency, which dispatched inspectors. The source was traced to a manufacturing plant, which was issued a violation and fined $250,000. The plant installed pretreatment to prevent future incidents.
Case 3: Drinking Water Source Protection
A water utility installed a monitoring station upstream of its intake on a major river. The station monitored water level, flow, pH, turbidity, and conductivity. During a spring runoff event, turbidity spiked to 45 NTU. The utility was able to adjust its treatment process in advance, preventing a treatment plant shutdown and ensuring continued supply of safe drinking water.
8. Implementation Recommendations
-
Identify critical locations: Map high-risk flood zones, industrial areas, and drinking water intakes
-
Determine alert thresholds: Establish site-specific baselines for water level and quality parameters
-
Select robust sensors: Choose sensors with proven performance in river environments (fouling resistance, corrosion resistance)
-
Ensure reliable telemetry: Use redundant communication paths (e.g., cellular + satellite) for critical sites
-
Develop maintenance plan: Schedule regular sensor cleaning, calibration, and system checks
-
Integrate with existing systems: Connect to agency dashboards, GIS, and emergency management systems
-
Establish data sharing protocols: Define who receives alerts and how data is shared with stakeholders
9. Frequently Asked Questions
Q1: How often should river monitoring sensors be calibrated?
A: pH and conductivity sensors: monthly; turbidity: monthly; water level sensors: annually or after significant events. Always calibrate after cleaning or flooding events.
Q2: Can these systems operate in extreme weather conditions?
A: Yes, with proper design. Sensors and enclosures are rated IP65/67. Solar systems have battery backup for cloudy periods. Redundant telemetry ensures data transmission.
Q3: How is power supplied to remote stations?
A: Solar power with battery backup is the most common solution for remote locations. Mains power with UPS is used where available. Some sensors have very low power consumption for extended battery operation.
Q4: How do I set alert thresholds for water quality?
A: Establish a baseline by monitoring for 1-2 months. Set thresholds based on baseline + 20% or the applicable regulatory standard (e.g., pH 6.5-8.5). Adjust thresholds as needed.
Q5: What happens if the system loses communication?
A: The data logger stores data locally. When communication is restored, data is automatically uploaded. Alert systems are designed with redundant notification paths.
10. Conclusion: Protecting Rivers with Intelligent Monitoring
Key Takeaways:
-
Integrated river monitoring systems provide real-time data on water level, flow, and water quality
-
Early warning of flood risks enables timely evacuations and property protection
-
Water quality monitoring detects pollution events and provides evidence for enforcement
-
Data from these systems supports regulatory compliance, ecosystem protection, and public safety
-
Modular, scalable systems can be deployed for both permanent and temporary monitoring needs
Implementing an integrated river monitoring system is an investment in public safety, environmental protection, and resource management. By combining water level, flow, and water quality monitoring with real-time telemetry and automated alerts, authorities can respond proactively to flood events, detect and enforce against pollution, and safeguard river ecosystems for future generations.