How Online DO Monitor Raised Fish Fry Survival Rate by 25%?
TIME: 2026.05.19AUTHOR: Coco LiNUMBER OF VIEWS 1098
Case Study: How Online DO Monitor Raised Fish Fry Survival Rate by 25% | Aquaculture Success
REAL SUCCESS STORY · HATCHERY AUTOMATION
Case Study: Online DO Monitor Raised Fish Fry Survival Rate by 25%
How a tilapia hatchery in Southeast Asia transformed their nursing ponds with real‑time dissolved oxygen monitoring and automatic aeration — increasing survival from 72% to 90% while cutting electricity costs.
Tilapia hatchery · 8 nursery ponds 12-month case study +25% survival rate
+25%
Fry survival rate
72% → 90% in 8 months
-18%
Aeration energy cost
Smart control reduces waste
0
Nighttime hypoxia events
After automation deployment
<6 mo
Payback period
ROI from reduced mortality
Farm background & the challenge
Location: Freshwater tilapia hatchery, 8 nursery ponds (each 500 m²), producing ~2 million fry per cycle. Traditional practice: Pond managers measured dissolved oxygen (DO) manually twice per day (morning & evening) using portable meters. Aerators (paddlewheels) were turned on at fixed schedules — typically 6 hours during night regardless of actual oxygen levels.
The problem: Despite scheduled aeration, nighttime DO crashes often occurred between 2:00 AM and 5:00 AM due to high fry density and phytoplankton respiration. Manual spot checks missed these drops, resulting in repeated sub‑lethal stress and mortality. Average fry survival rate was only 72% — far below the hatchery's target of 85%.
"We lost thousands of fry every month. The worst part was waking up to find dead fish and not knowing why – our fixed aeration schedule wasn't enough." – Farm owner
Solution: online DO monitoring + automatic aeration
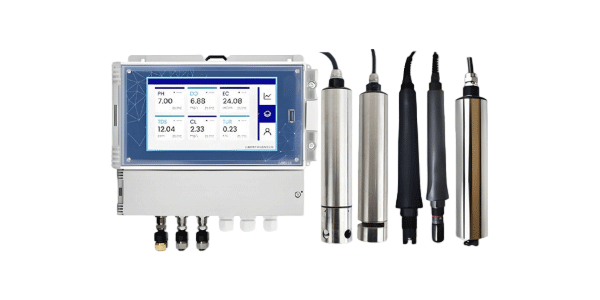
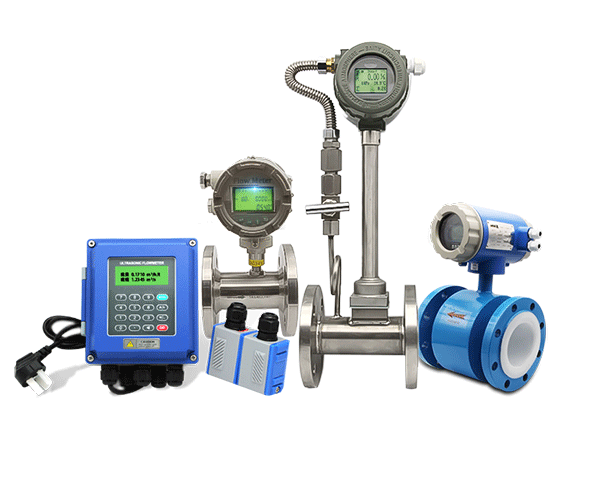
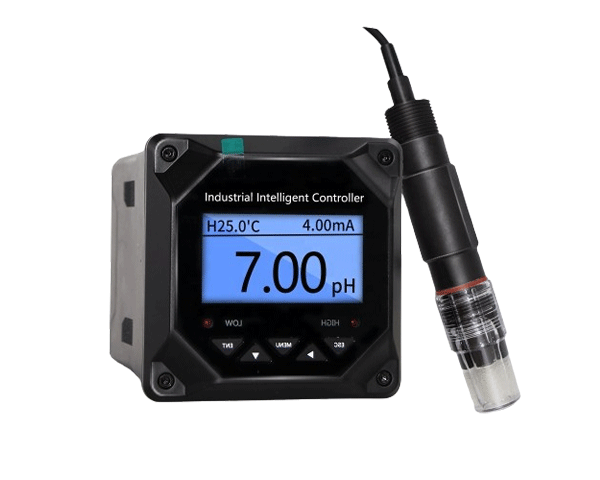
Hardware installed
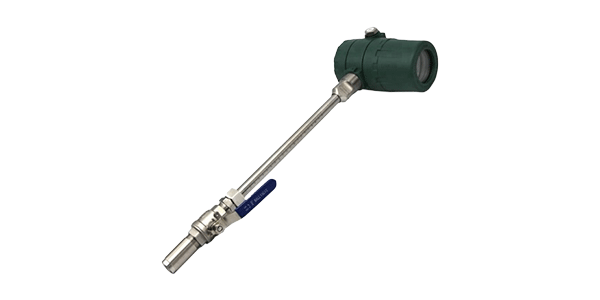
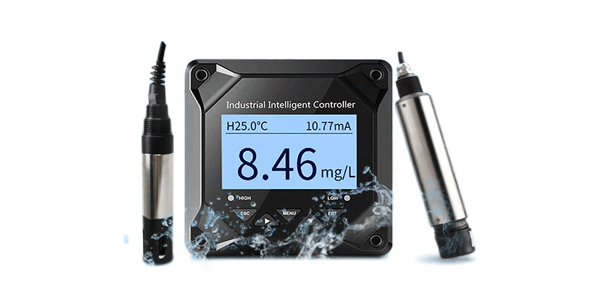
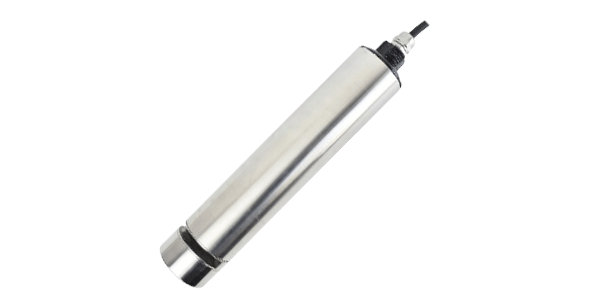
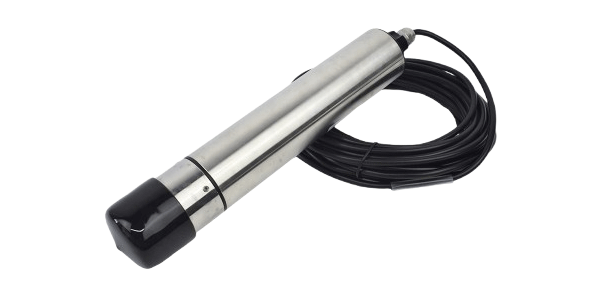
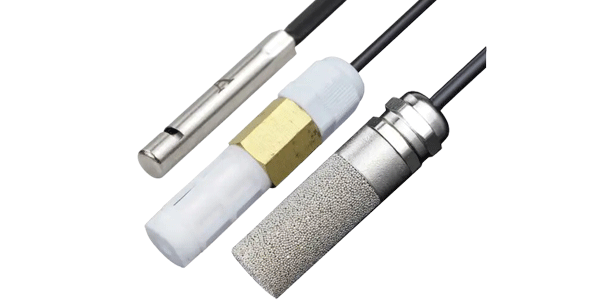
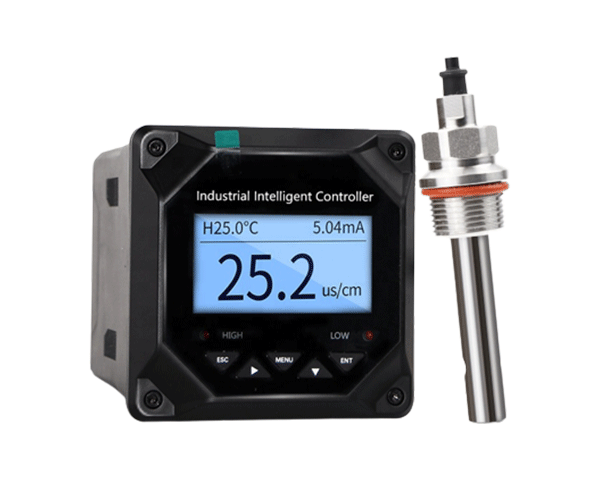
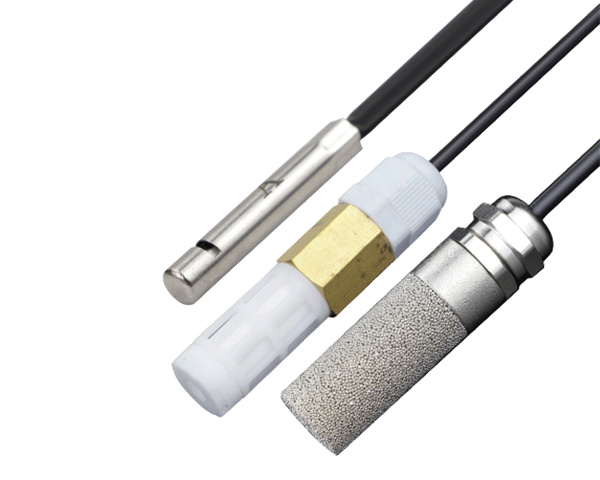
Optical fluorescence DO sensors (IP68, salinity compensation) – one per pond
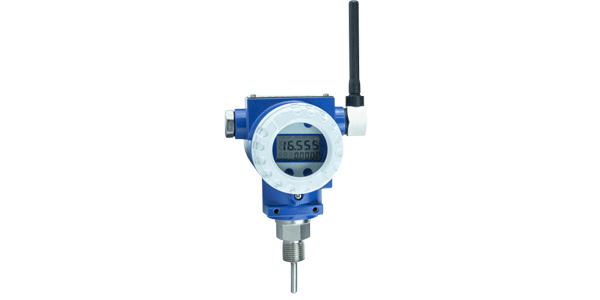
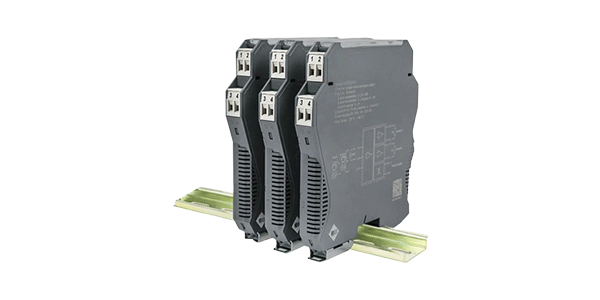
4G RTU controllers with relay outputs
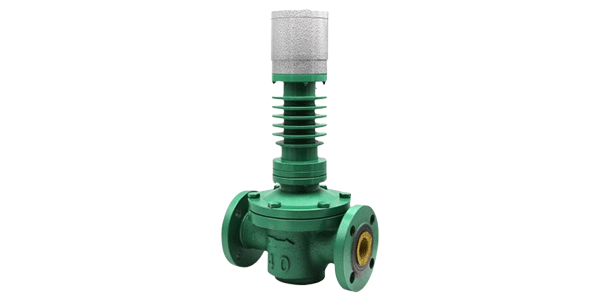
Wireless contactors for existing paddlewheel aerators
Cloud platform + mobile app with SMS/push alerts
Automation logic
DO threshold: Aerators ON at 3.5 mg/L (for fry), OFF at 5.0 mg/L
Time‑delayed hysteresis: aerators run min. 15 minutes to avoid cycling
SMS alerts: when DO < 3.0 mg/L (critical) and sensor failure
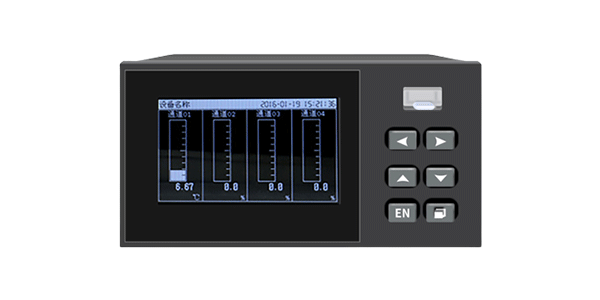
Cloud dashboard: real‑time DO trends, historical logs, remote override
Implementation timeline
Month 1: System design + sensor placement (one pond pilot). Staff training on cloud platform.
Month 2-3: Pilot pond showed 0 hypoxia events, survival rate increased from 71% to 86% in that pond.
Month 4: Full deployment across all 8 nursery ponds + automatic aeration integration.
Month 5-12: Continuous remote monitoring. Farm adjusted feeding and aeration schedules based on DO trends.
Before vs. after: key performance indicators
Metric
Before (manual checks)
After (online DO + auto aeration)
Improvement
Fry survival rate
72%
90%
+25%
Nighttime DO below 3.0 mg/L (events/month)
6-8 events
0 events
100% elimination
Aeration runtime (hours/day)
6.5 hrs (fixed)
4.2 hrs (on‑demand)
-35% runtime
Electricity cost (USD/month per pond)
$215
$176
-18%
Farm staff night checks
2-3 times/night
0 (remote alarms only)
Labor reduced
Fry mortality (thousands/cycle)
560,000 lost
200,000 lost
64% fewer deaths
Annual economic impact: Reduced fry mortality alone saved over $18,000 per year. Combined energy savings added another $3,700. The entire system paid for itself in less than 6 months.
Why survival increased: the oxygen‑fry connection
Eliminated hidden hypoxia
Before automation, DO often dropped below 2.5 mg/L between 2–5 AM without anyone knowing. Fry (especially <5g) are highly sensitive: prolonged exposure to DO <3 mg/L causes permanent gill damage and immunosuppression. Real‑time alerts triggered aeration before levels became lethal.
Reduced chronic stress
Even "mild" nightly dips from 5.0 → 3.5 mg/L cause elevated cortisol in fry, reducing feeding and growth. The automated system kept DO stable above 4.5 mg/L at all times, resulting in healthier, more robust fry.
Smart aeration timing
Instead of running aerators continuously from midnight to 6 AM, the system turned them on only when needed. This not only saved energy but also prevented over‑turbulence that stresses delicate fry.
Data‑driven pond management
Analyzing DO trends helped the farm adjust stocking density and feeding rates. The historical logs showed which ponds had poorer oxygen retention, allowing targeted aeration upgrades.
Farm manager's perspective
"Before the online DO system, I was waking up 2–3 times every night to check oxygen, and still losing fish. Now I get an SMS only if something goes wrong — which almost never happens. Our survival rate jumped from 72% to 90%, and my team sleeps through the night. The 25% increase means we deliver 200,000 more healthy fry per cycle. That's life‑changing for our business."
— Mr. Somchai, Hatchery Operations Manager
Return on investment (ROI) breakdown
Investment item
Cost (USD)
8 optical DO sensors + RTUs
$9,600
Contactors & electrical work
$1,200
Cloud platform license (12 months)
$480
Total initial investment
$11,280
Annual savings/benefit
Value (USD)
Value of saved fry (360,000 more survivors @ $0.06 each)
$21,600
Energy savings (18% reduction)
$3,700
Reduced labor (night checks eliminated)
$4,800
Total annual benefit
$30,100
ROI calculation: $11,280 investment ÷ $30,100 annual benefit = payback period of 4.5 months. Over 5 years, net benefit exceeds $130,000.
What's next for the farm?
Encouraged by the results, the hatchery is now expanding the system to:
Integrate automatic feeding based on DO and temperature trends
Install backup battery systems for the controller to ensure alerts during power outages
Use DO historical data to optimize aeration capacity for higher stocking densities (+20% planned)
The farm owner is now considered a regional reference for smart aquaculture technology.
Can your farm achieve similar results?
Whether you raise tilapia, catfish, or shrimp, real‑time DO monitoring and automated aeration directly impact survival, growth, and energy efficiency. Start with a pilot pond and see the difference within weeks.
📈 Higher survival · ⚡ Lower costs · 🌙 Peace of mind
Compare the total cost of ownership (TCO) of multi-parameter water quality analyzers vs. single-parameter instruments. Analyze purchase costs, installation, maintenance, labor, consumables, and energy savings. Discover the ROI of integrated multi-parameter solutions.
Get answers to 10 frequently asked questions about multi-parameter water quality analyzers. Learn about channel configuration, temperature compensation, sensor compatibility, calibration, data logging, and troubleshooting tips for optimal performance.
Explore the versatile applications of multi-parameter water quality analyzers in environmental monitoring and wastewater treatment. Learn how real-time pH, DO, conductivity, turbidity, and ammonia monitoring optimizes treatment processes, ensures compliance, and protects water resources.