
- Explore More For
Industrial Measurement
- Product
- Flow Measurement
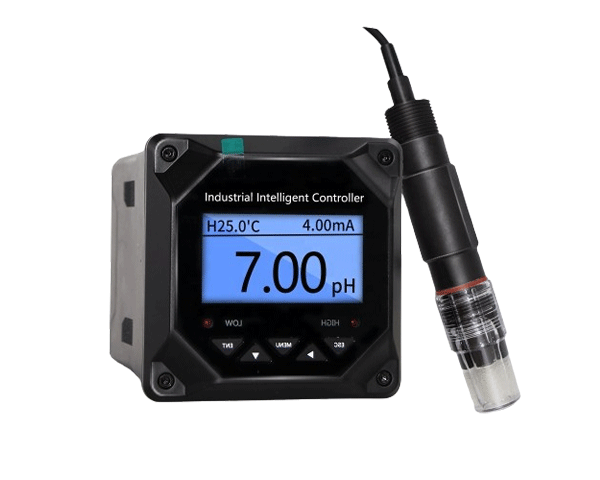
- Water Quality Meter
- Wireless Measurement
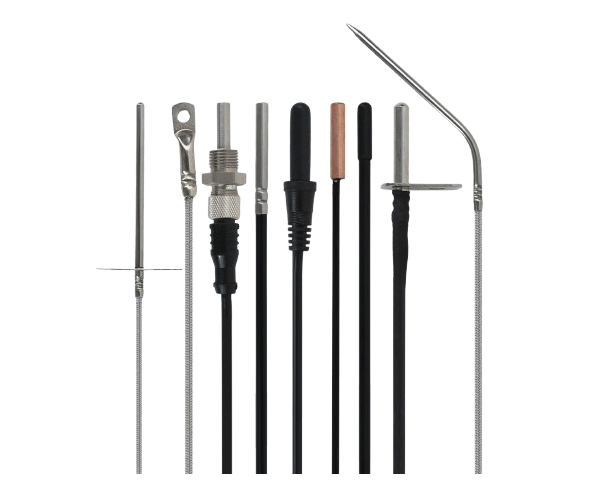
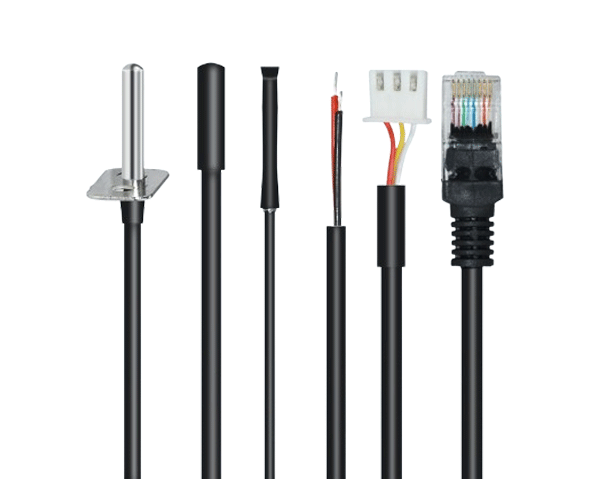
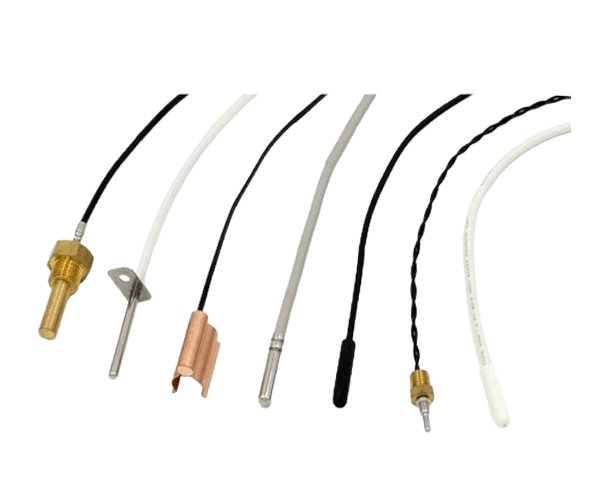
- Temperature Measurement
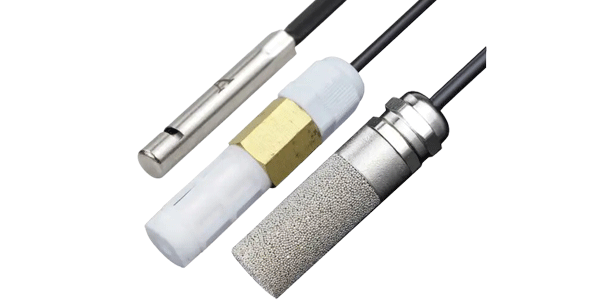
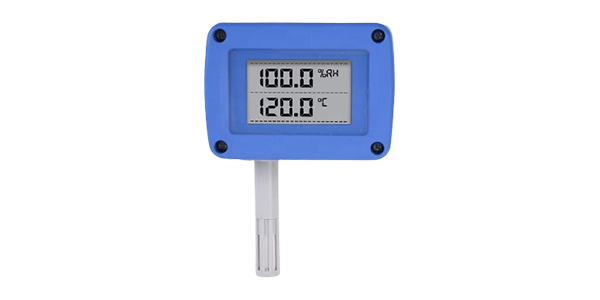
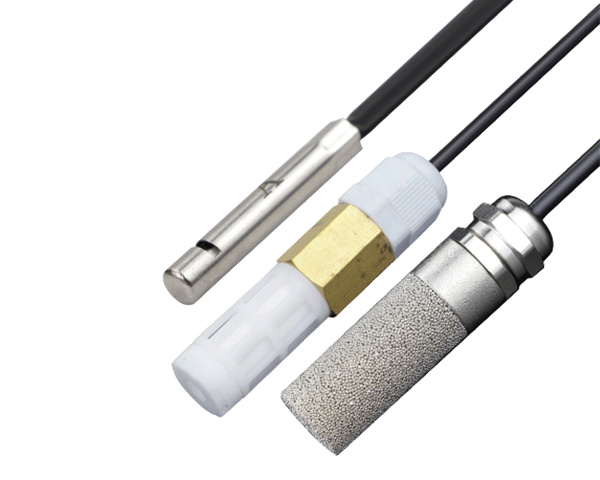
- Temperature Humidity Measurement
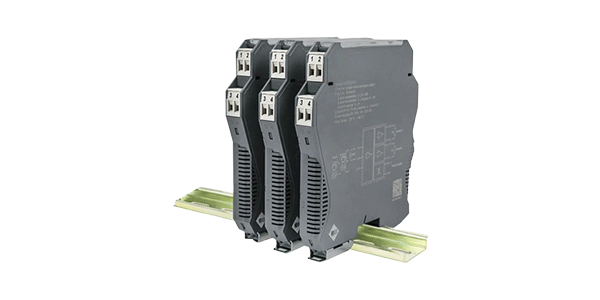
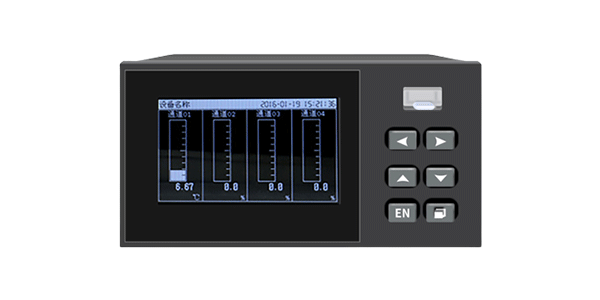
- Accessory product
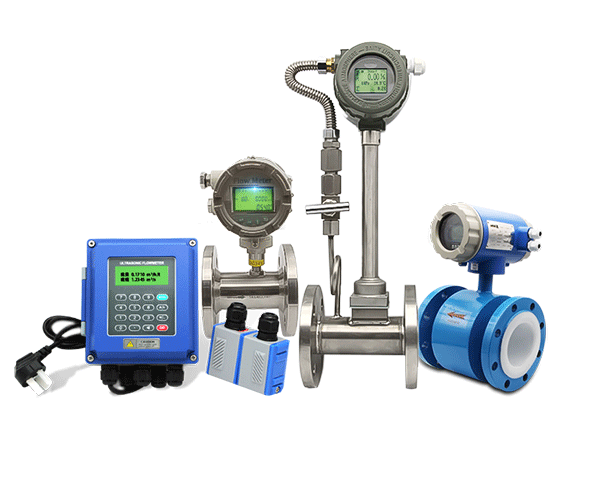
- Ultrasonic Flow Meter Electromagnetic Flow Meter Turbine Flow Meter Vortex Flow Meter Thermal Gas Mass Flow Meter Oval Gear Flow Meter
-
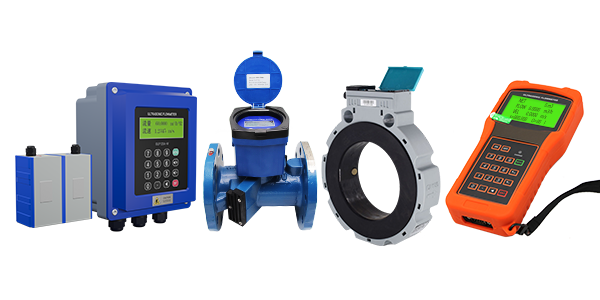
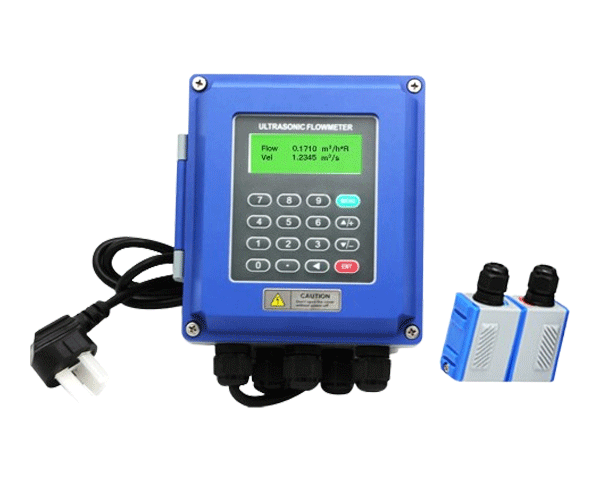
Ultrasonic Flow Meter
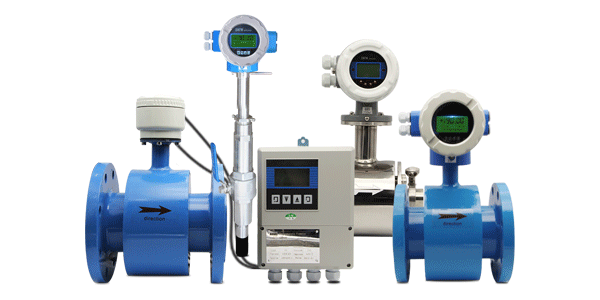
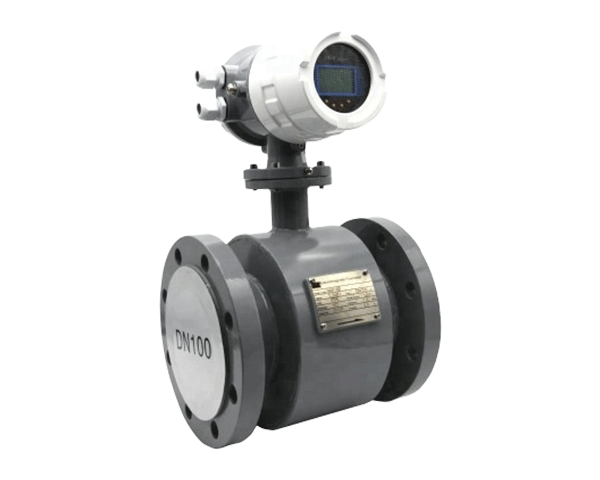
Electromagnetic Flow Meter
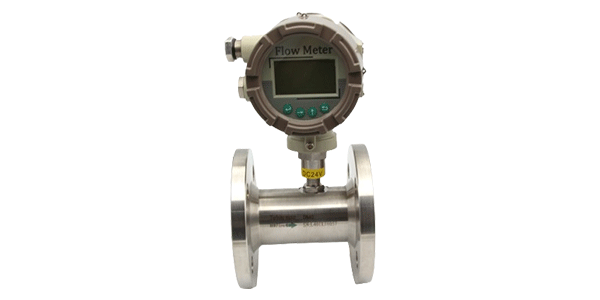
Turbine Flow Meter
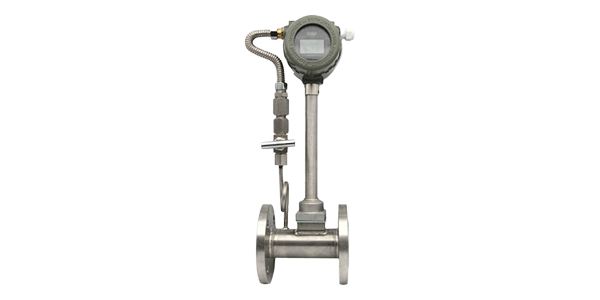
Vortex Flow Meter
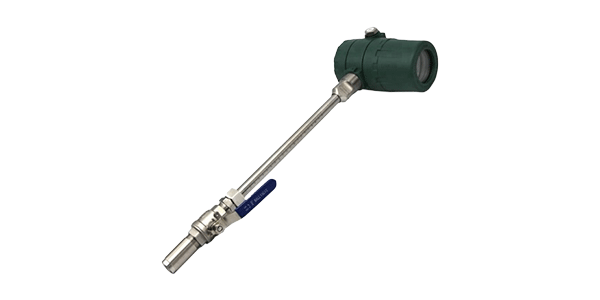
Thermal Gas Mass Flow Meter
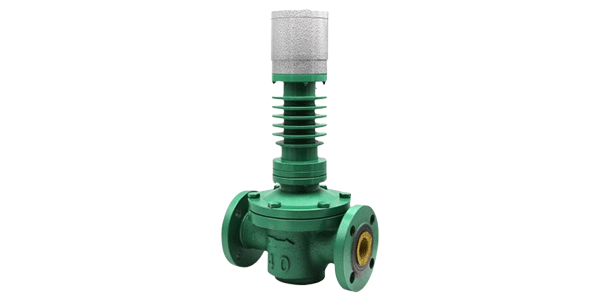
Oval Gear Flow Meter
- pH Meter Conductivity Meter Dissolved Oxygen Meter Residual chlorine meter Turbidity meter Salinity meter COD meter Ammonia nitrogen Meter Multiparameter
-
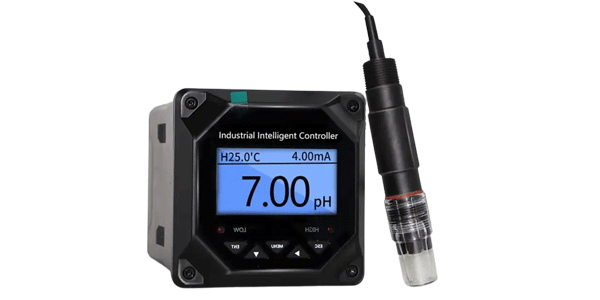
pH Meter
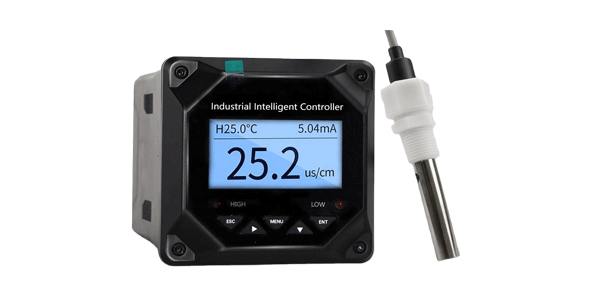
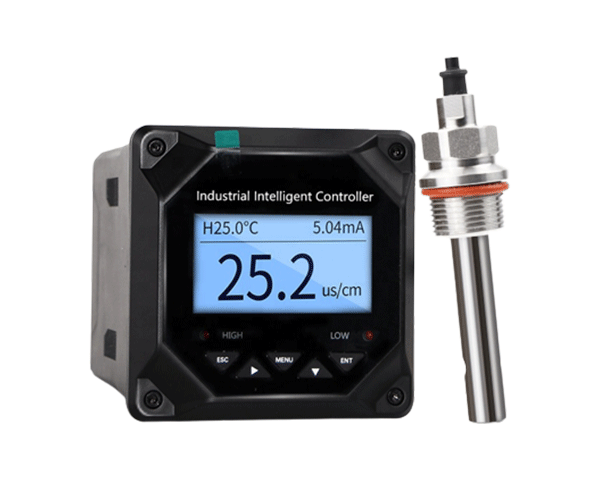
Conductivity Meter
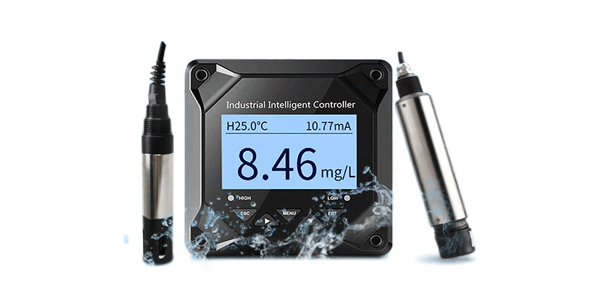
Dissolved Oxygen Meter
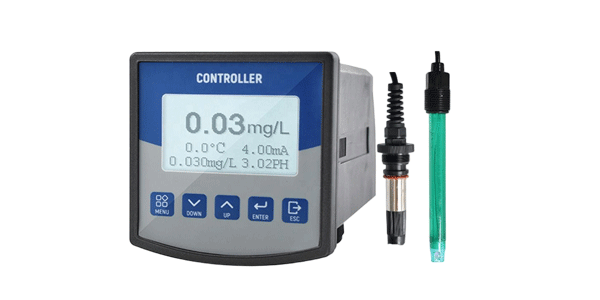
Residual chlorine meter
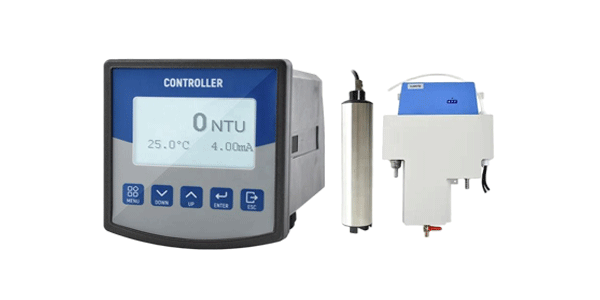
Turbidity meter
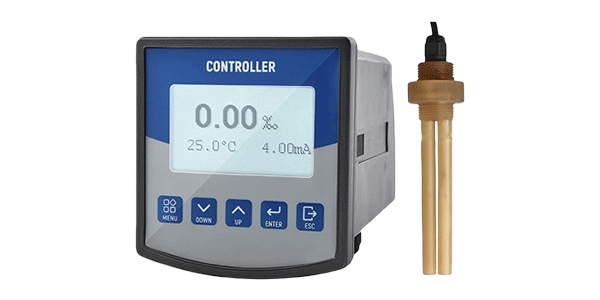
Salinity meter
COD meter
Ammonia nitrogen Meter
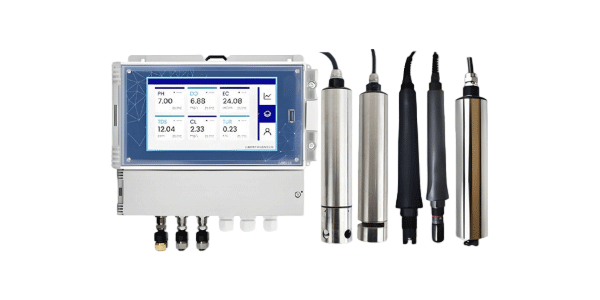
Multiparameter
- Wireless Temperature Transmitter Wireless temperature humidity transmitter Wireless Thermometer
-
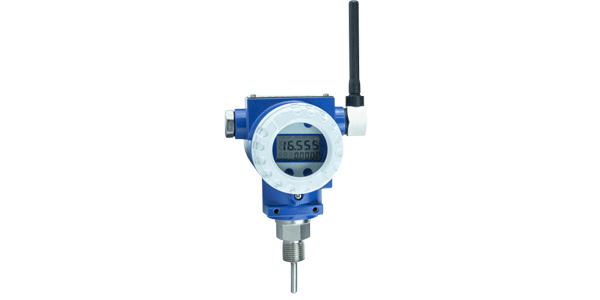
Wireless Temperature Transmitter
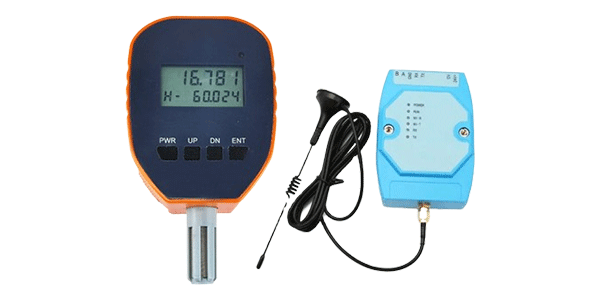
Wireless temperature humidity transmitter
Wireless Thermometer
- Temperature Sensor Temperature Transmitter Thermometer
-
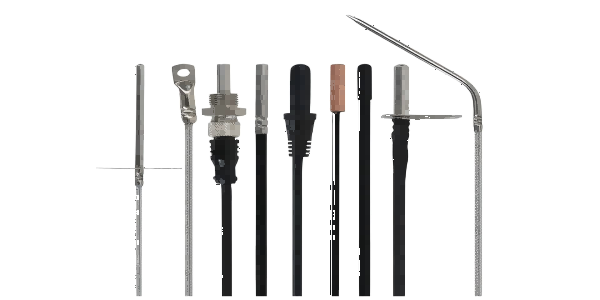
Temperature Sensor
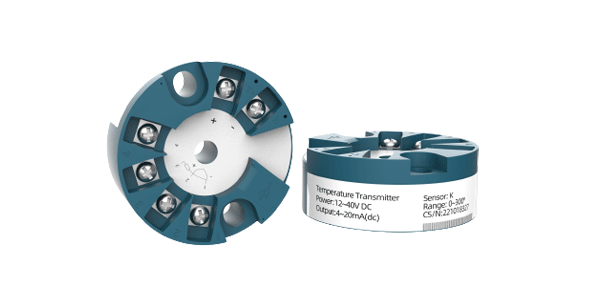
Temperature Transmitter
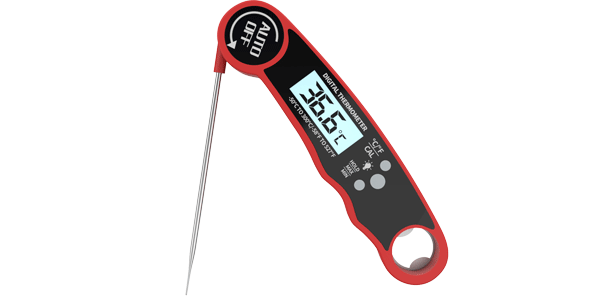
Thermometer
- Solution
- Water Treatment Food Beverage Smart Agriculture Smart Home Oil and Gas Cold Chain Transportation Office Industrial Equipment New Energy Vehicle Pharmaceutical Medicine Electricity Energy
-

Water Treatment
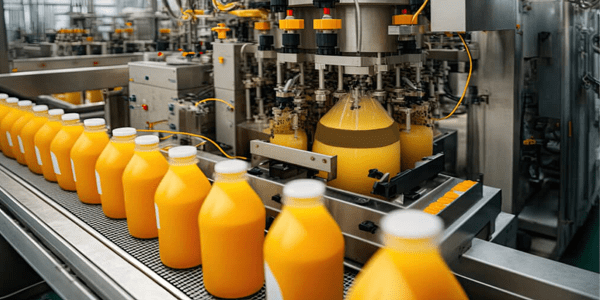
Food Beverage

Smart Agriculture

Smart Home
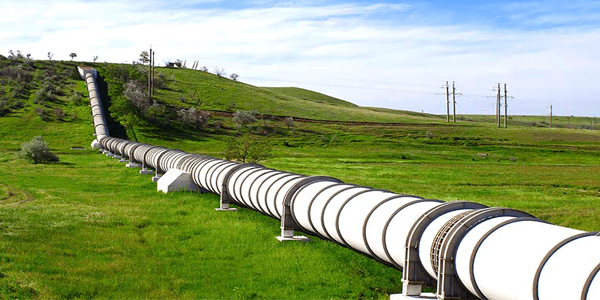
Oil and Gas
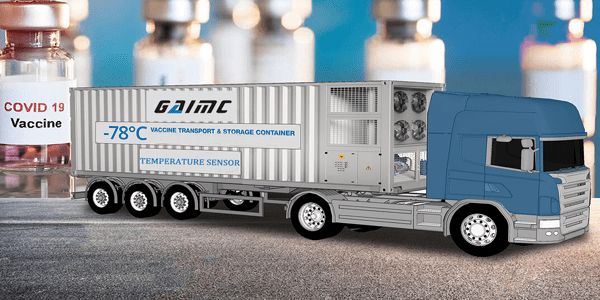
Cold Chain Transportation
Office Industrial Equipment

New Energy Vehicle

Pharmaceutical Medicine

Electricity Energy
- Service
- Support
- IOT
- About us