How to Schedule Sensor Calibration & Replacement Cycles?
TIME: 2026.05.22AUTHOR: Coco LiNUMBER OF VIEWS 1594
Multi-Parameter Analyzer Maintenance Calendar: How to Schedule Sensor Calibration & Replacement Cycles
Preventive maintenance · Maximize uptime
Multi-Parameter Analyzer Maintenance Calendar: How to Schedule Sensor Calibration & Replacement Cycles
A systematic maintenance calendar prevents data drift, unexpected sensor failure, and costly downtime. Learn optimal calibration frequencies, replacement intervals for pH, DO, conductivity, turbidity sensors, and how to build a rolling 12-month plan.
Planned maintenance Sensor life tables Log templates
From reactive to planned: the cost of neglecting sensor care
Unplanned sensor failure leads to data gaps, false alarms, or missed toxicity events. A well-designed maintenance calendar reduces emergency interventions, extends sensor life by 20-40%, and ensures regulatory compliance. This guide provides sensor-specific schedules, life expectancy tables, and a printable yearly planner for multi-parameter water quality analyzers (pH, DO, conductivity, turbidity, ammonia, optical sensors).
Recommended 12‑month maintenance calendar
Sensor / Task
Weekly
Monthly
Quarterly (3 mo)
Bi-annual (6 mo)
Annual (12 mo)
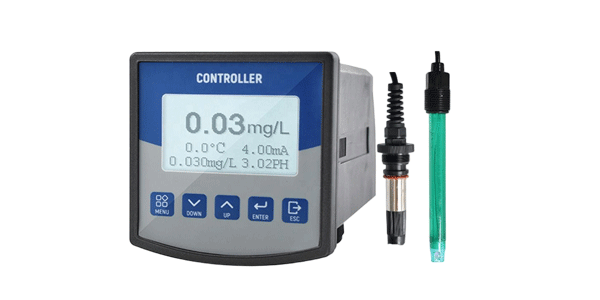
pH / ORP
Visual check, rinse
Calibration (2-point)
Clean & inspect junction
Replace if slope <85%
Replace reference electrolyte (if refillable)
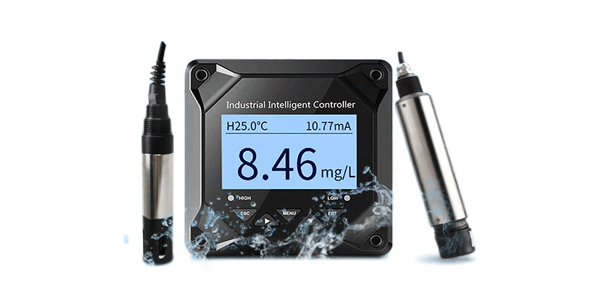
Optical DO (fluorescence)
Wipe cap gently
Air calibration
Inspect for scratches
Check cap integrity
Replace optical cap (every 2-3 years)
Polarographic DO
Check membrane for bubbles
Replace membrane + electrolyte
Zero calibration (sulfite)
Replace sensor body (if drift >0.3 mg/L)
Full sensor replacement (2 years typical)
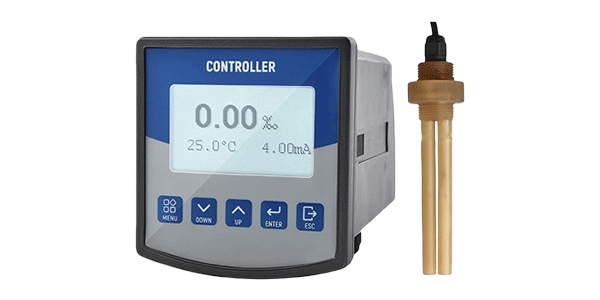
Conductivity (4-electrode)
Rinse with DI water
Calibration with standard (1-point)
Clean electrodes (soft brush)
Check cell constant
Replace if cell constant drift >5%
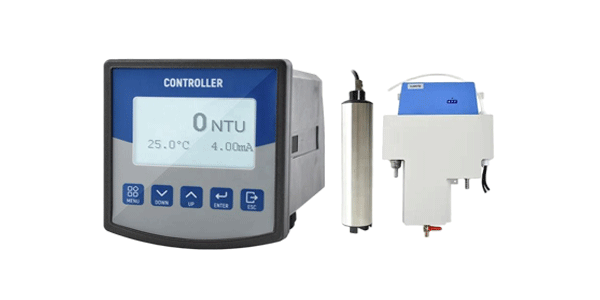
Turbidity (ISO 7027)
Wipe optical window
Calibration with formazin/stablcal
Deep clean (detergent)
Check for scratches
Factory recalibration or replace
Ammonia / ISE sensors
Conditioning check
Calibration (2-point)
Replace membrane (if applicable)
Refill electrolyte
Replace sensor tip
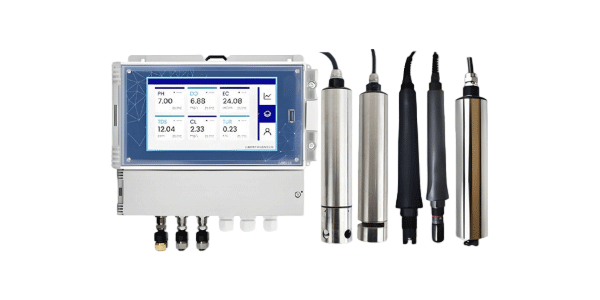
Multi-parameter controller
Check display & alarms
Backup data (TF card)
Check relay/logic functions
Firmware update
Inspect power & terminals
Pro tip: Adjust frequency based on application harshness. Wastewater and aquaculture may require 2x more frequent maintenance than clean water monitoring.
Cap life: 2–4 years (sensor body 5+ years). Replace cap when: Calibration slope <70-80% of factory value, scratches on cap, or drift >0.3 mg/L after cleaning.
Conductivity sensors
Typical life: 3–5 years (inductive or 4-electrode). Replace when: Cell constant changes >5%, physical erosion, or cable damage.
Turbidity sensors
Typical life: 2–4 years (LED-based). Replace when: Calibration fails (stablcal), scratches on optical window, or unstable readings.
Calibration frequency guidelines by application
Application environment
pH calibration
DO calibration
Conductivity
Turbidity
Clean water / drinking water
Monthly
3 months (optical) / 2 weeks (polarographic)
3 months
6 months
Wastewater treatment
2 weeks – 1 month
1 month (optical) / weekly (polarographic)
1 month
1 month
Aquaculture (ponds)
Monthly
2 months (optical only)
2 months
Optional
Environmental / river monitoring
Monthly
3 months (optical sondes)
3 months
3 months
Always recalibrate after any sensor cleaning, membrane change, or electrolyte refill.
How to build your custom maintenance calendar
Step 1: Inventory your sensors
List all parameters, sensor models, and their installation date. Note manufacturer-recommended calibration and replacement intervals.
Step 2: Determine risk-based frequency
Increase frequency for: high biofouling, extreme temperatures, chemical exposure, or regulatory criticality.
Step 3: Set recurring tasks
Use digital or paper planner: weekly visual checks, monthly calibrations, quarterly deep cleaning, annual replacement planning.
Step 4: Create a calibration log
Track slope, offset, and response time after each calibration. Early drift detection prevents sudden failure.
Step 5: Schedule reminders
Use phone calendar, ERP, or CMMS with 1-week advance notifications. Order consumables (membranes, electrolyte, caps) before they expire.
📅 Pro tip: Align calibration with existing site visits to reduce travel cost.
Check for freezing damage (sensor bodies). Optical DO caps may become brittle. Increase visual checks.
Summer / algae blooms
Accelerated biofouling: increase cleaning frequency (weekly for turbidity/DO). Consider automatic brush systems.
After process upsets
Chemical spills, high temperature shocks → perform immediate calibration verification and sensor inspection.
Before regulatory audits
Perform full calibration + verification 1 week prior. Backup data logs and calibration certificates.
Cost impact: reactive vs. planned maintenance
Scenario
Reactive (failure-driven)
Planned (calendar-based)
Sensor lifespan
30-50% shorter
Maximized (up to full manufacturer spec)
Unplanned downtime
24-72 hours (waiting for parts)
<1 hour (spare on hand)
Data quality
Risk of undetected drift for weeks
Consistently accurate
Annual maintenance cost
Higher (emergency labor + expedited shipping)
20-30% lower
Investment in a maintenance calendar reduces total cost of ownership by an average of 25% across 5 years.
Frequently asked questions
Q1: How do I know if my pH sensor needs replacement before the scheduled date?
A: Monitor slope and offset in the calibration log. Slope <85% or offset >±30 mV indicates end of life. Also slow response (>60 sec) or erratic readings.
Q2: Can optical DO sensors be calibrated less frequently than monthly?
A: In stable environments (clean water, stable temp), every 2-3 months is acceptable. In harsh conditions (wastewater, aquaculture), monthly air calibration is recommended.
Q3: Do I need to replace the entire turbidity sensor or just the wiper/calibration kit?
A: Usually the sensor lasts 2-4 years. If calibration fails with fresh standard and cleaning, replace the sensor.
Q4: What is the best way to store spare sensors?
A: pH: store in 3M KCl solution (never dry). Optical DO: dry with protective cap. Conductivity: dry or in DI water. Turbidity: dry in dust-free container.
Q5: How to handle sensors for seasonal shutdown?
A: Remove from process, clean thoroughly, store per manufacturer. For polarographic DO, keep membrane moist. For pH, keep in storage solution. Perform full calibration before reinstallation.
Printable maintenance summary (at-a-glance)
Every week: Visual check, clean if fouled, check cables Every month: Calibrate pH, conductivity, turbidity (air cal for DO) Every 3 months: Replace polarographic DO membrane, deep clean turbidity, verify relays
Every 6 months: Replace optical DO cap (if drift), check reference junctions Annually: Full sensor diagnostic, backup data, firmware update, replace pH probe if slope degraded
📌 Keep a copy inside the analyzer panel door for field technicians.
Start your maintenance calendar today
Implement a simple spreadsheet or CMMS. Set recurring reminders. Order consumables with a lead time of 2 months. Track sensor performance — you will see fewer emergency calls, lower costs, and auditable data quality.
✔ Extended sensor life ✔ Reliable data ✔ Regulatory readiness
Discover how temperature transmitters and ultrasonic flow meters work together in power plants. Learn about steam temperature monitoring, feedwater flow measurement, cooling water systems, and turbine efficiency optimization in thermal, nuclear, and hydroelectric power generation.
Learn how temperature and humidity sensors optimize incubator environments for poultry, fish, and reptile hatcheries. Discover optimal temperature and humidity ranges, sensor placement, monitoring systems, and best practices to maximize hatch rates and survival.
Discover how temperature sensors ensure safety and efficiency in electric vehicles (EV) and traditional vehicles. Learn about battery thermal management, motor and inverter monitoring, engine and transmission temperature control, and automotive sensor technologies.