


1️⃣ Importance of Turbidity Control in Drinking Water
What is Turbidity and Why Does It Matter?
Turbidity refers to the cloudiness or haziness of water caused by suspended particles such as clay, silt, organic matter, algae, and microorganisms. In drinking water treatment, controlling turbidity is critical for several key reasons:
Key Impacts of Turbidity on Water Quality
- Reduced Disinfection Effectiveness: Suspended particles can shield microorganisms from disinfectants like chlorine, UV light, or ozone
- Microbial Protection: Pathogens can attach to particles, increasing their resistance to treatment processes
- Increased Chemical Demand: Higher turbidity requires more coagulants and disinfectants
- Disinfection Byproduct Formation: Organic particles can react with chlorine to form harmful DBPs
- System Clogging: Particles can accumulate in distribution systems and household plumbing
Health Implications
Numerous studies have shown correlations between high turbidity levels and increased incidence of waterborne diseases. The CDC and WHO recognize turbidity control as a critical barrier against pathogens like Cryptosporidium, Giardia, and E. coli.
2️⃣ Regulatory Standards & Requirements
EPA Turbidity Regulations (USA)
The U.S. Environmental Protection Agency establishes strict turbidity standards under the Surface Water Treatment Rule (SWTR) and Long Term 2 Enhanced Surface Water Treatment Rule (LT2ESWTR):
| Regulation | Requirement | Compliance Level | Monitoring Frequency |
|---|---|---|---|
| Filtered Water Turbidity | ≤ 0.3 NTU | 95% of daily samples | Continuous (every 15 minutes) |
| Maximum Turbidity | ≤ 1 NTU | No single measurement | Continuous (every 15 minutes) |
| Individual Filter Effluent | ≤ 0.15 NTU | 95% of measurements | Continuous (every 15 minutes) |
| Source Water (Surface) | Varies by treatment | Baseline assessment | Daily to monthly |
Table 1: EPA Turbidity Requirements for Drinking Water Systems
International Standards
- WHO Guidelines: Recommend turbidity < 1 NTU for effective disinfection, ideally < 0.1 NTU
- European Union: Requires turbidity < 1 NTU at consumer taps
- Canada: Operational guideline of ≤ 0.3 NTU for filtered water
- Australia: < 5 NTU at point of supply, < 1 NTU after filtration
3️⃣ Turbidity Treatment Technologies
Conventional Treatment Process
Aluminum sulfate, ferric chloride, or polymers added to destabilize particles
Gentle mixing to form larger floc particles from destabilized colloids
Flocs settle by gravity in clarifiers or sedimentation basins
Remaining particles removed through sand, multimedia, or membrane filters
Final treatment with chlorine, UV, or ozone to eliminate pathogens
Advanced Treatment Options
"Selecting the right turbidity removal technology depends on source water quality, plant capacity, operational expertise, and budget constraints. Membrane filtration offers superior performance but requires more maintenance and energy. Conventional treatment remains the most cost-effective for large-scale applications."
Comparison of Filtration Technologies
| Technology | Turbidity Removal Efficiency | Capital Cost | Operational Complexity | Best For |
|---|---|---|---|---|
| Rapid Sand Filtration | Good (to 0.3 NTU) | Low-Medium | Low | Large municipal plants |
| Membrane Filtration (MF/UF) | Excellent (to 0.1 NTU) | High | Medium-High | High-quality requirements |
| Slow Sand Filtration | Good (to 0.5 NTU) | Low | Very Low | Small communities |
| Diatomaceous Earth | Very Good (to 0.2 NTU) | Medium | Medium | Seasonal or emergency use |
4️⃣ Monitoring & Control Strategies
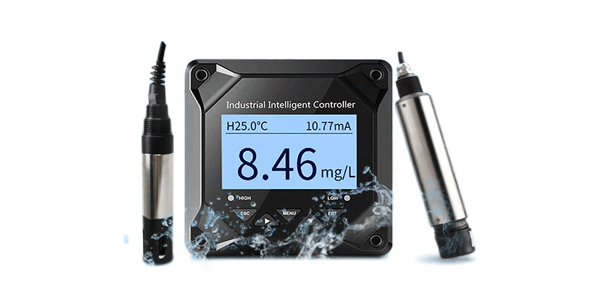
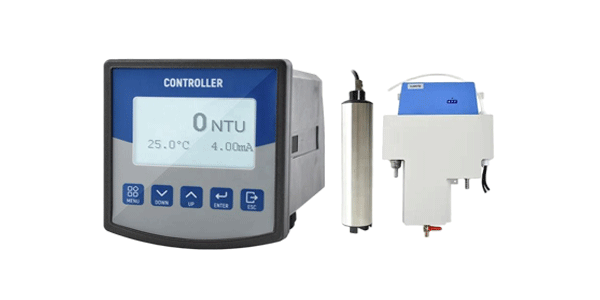
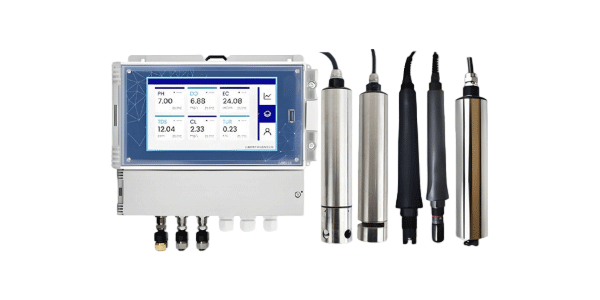
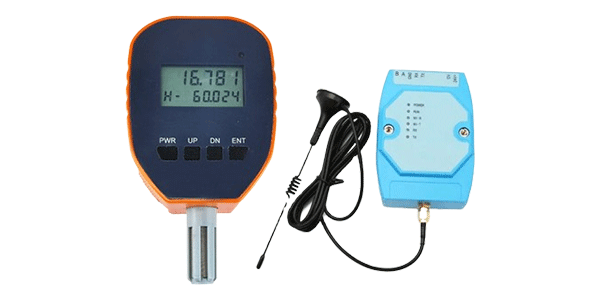
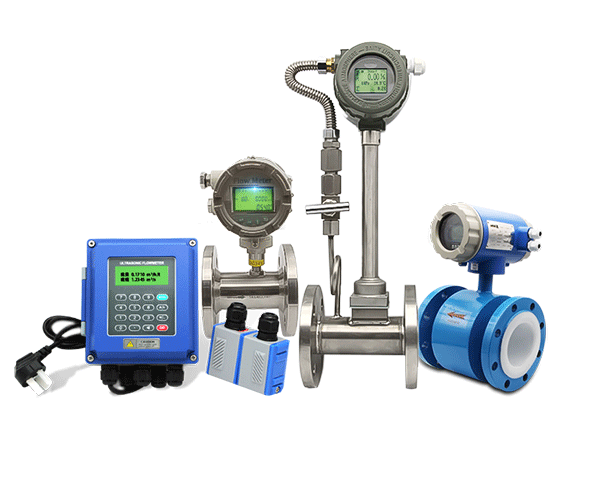
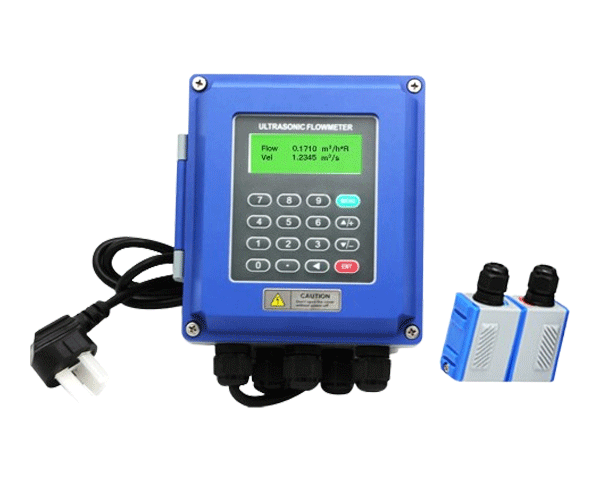
Online Turbidity Monitoring Systems
Modern water treatment plants employ continuous online turbidity monitoring at multiple critical control points:
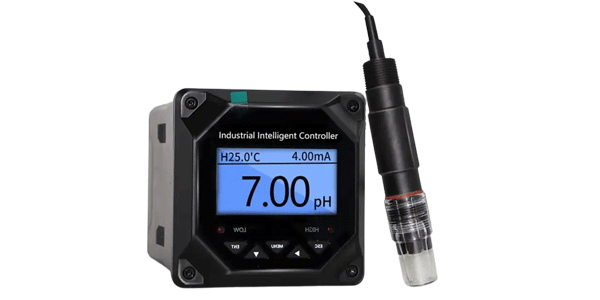
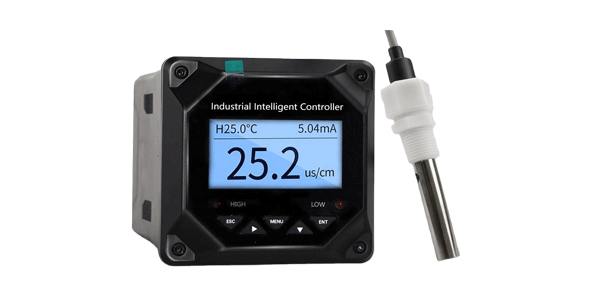
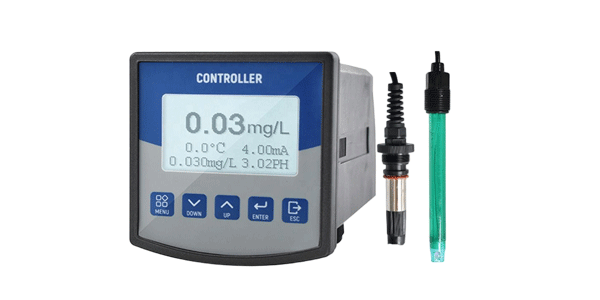
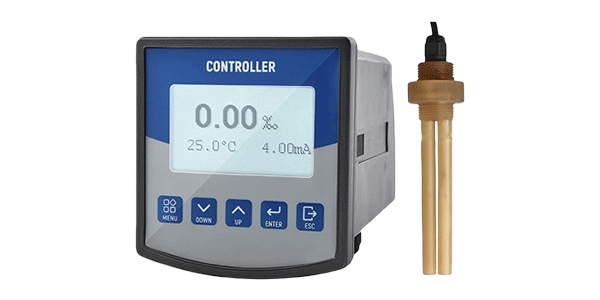
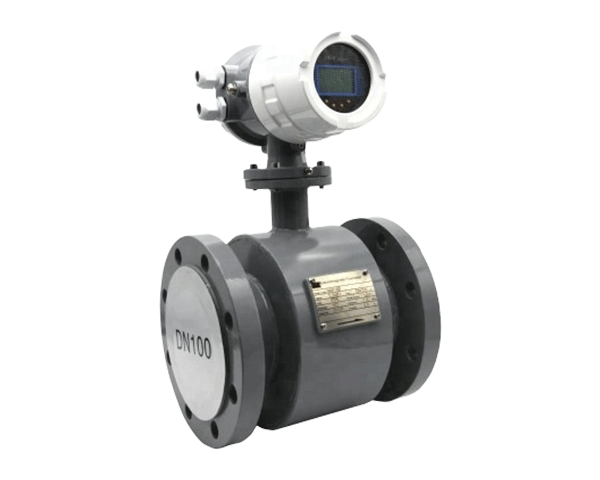
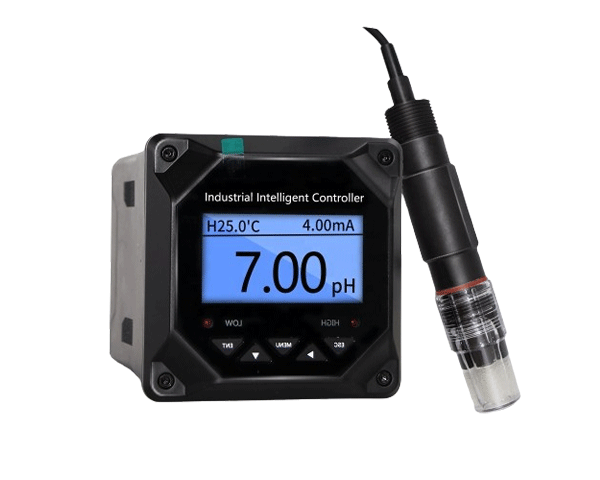
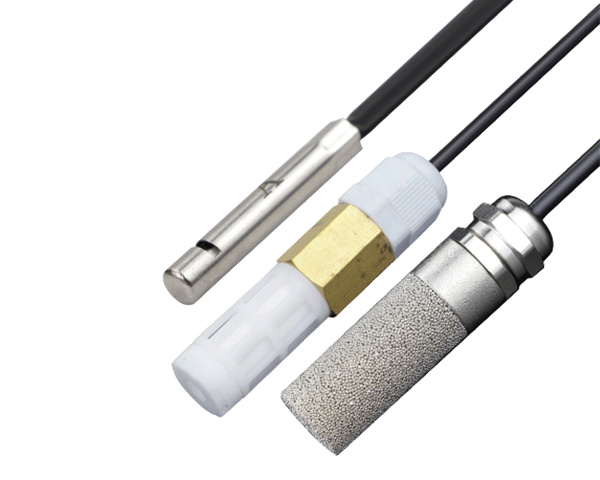
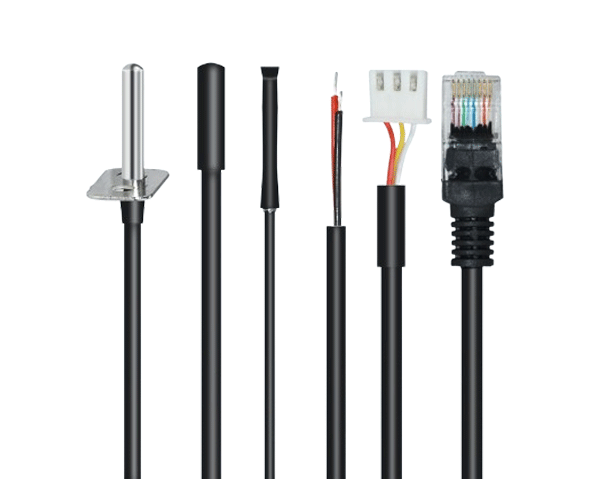
Monitoring Equipment Selection
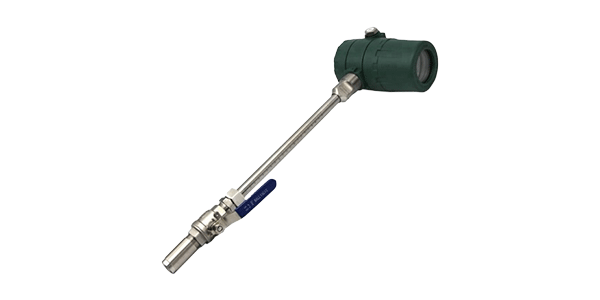
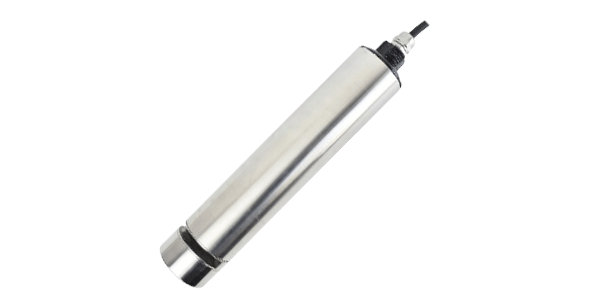
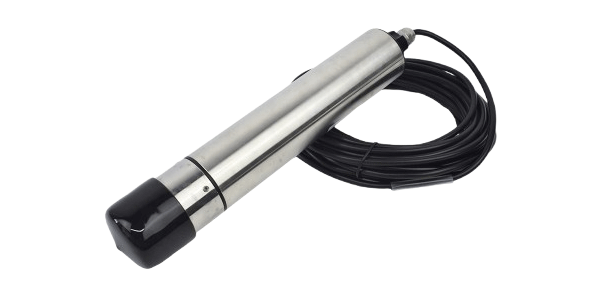
- Nephelometers: Standard 90° light scattering instruments for general monitoring
- Laser Turbidimeters: Higher precision for low turbidity measurements (< 0.1 NTU)
- Surface Scatter Sensors: For high turbidity applications or dirty optics
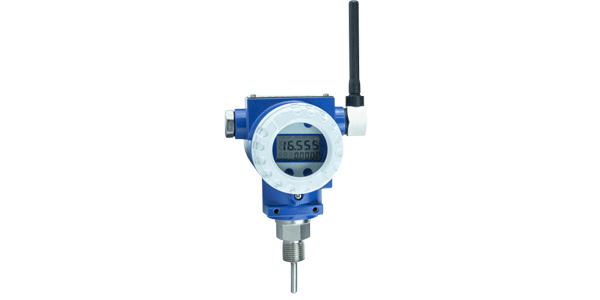
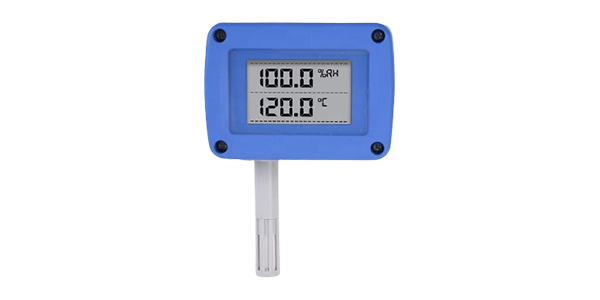
- Multi-parameter Sensors
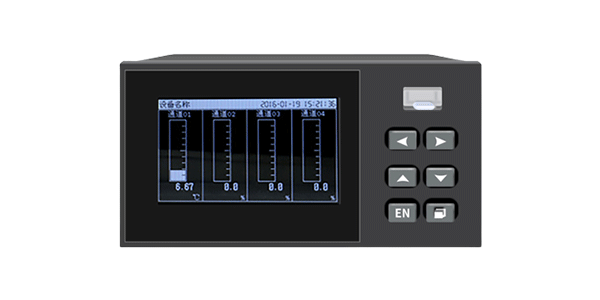
Data Management & SCADA Integration
Integrating turbidity data into SCADA systems enables:
- Real-time process adjustments based on turbidity trends
- Automated chemical dosing optimization
- Early warning alarms for filter breakthrough or process upsets
- Regulatory reporting and compliance documentation
- Historical data analysis for process optimization
5️⃣ Common Challenges & Solutions
Seasonal and Weather-Related Issues
"During heavy rainfall, turbidity spikes can overwhelm treatment systems. Implement these strategies: 1) Increase coagulant dosage based on streaming current monitoring, 2) Reduce filtration rate temporarily, 3) Consider polymer addition for improved floc formation, and 4) Have emergency storage capacity for high-turbidity water."
Common Operational Challenges
| Challenge | Causes | Immediate Actions | Long-term Solutions |
|---|---|---|---|
| Filter Breakthrough | Poor coagulation, high flow rates, media issues | Reduce flow, increase backwashing | Optimize coagulant dose, replace media |
| High Finished Water Turbidity | Process upset, equipment failure | Divert water, increase monitoring | SCADA upgrades, staff training |
| Chemical Overdosing | Poor control, rapid changes | Manual adjustment, lab testing | Automated dosing systems |
| Instrument Drift | Dirty optics, calibration issues | Clean, recalibrate | Preventive maintenance schedule |
6️⃣ Best Practices & Case Studies
Optimization Strategies
1. Jar Testing: Conduct regular jar tests to optimize coagulant type and dosage
2. Filter Performance Monitoring: Track each filter's turbidity removal efficiency
3. Operator Training: Ensure staff understand turbidity's importance and control methods
4. Preventive Maintenance: Regular calibration and cleaning of turbidity instruments
5. Data Analysis: Use historical data to identify trends and optimize processes
Case Study: Major Metropolitan Water Plant
Situation: A 100 MGD plant consistently struggled with turbidity compliance during spring runoff periods, with measurements occasionally exceeding 1 NTU.
Solution Implemented:
- Installed streaming current monitors for real-time coagulant control
- Upgraded to laser turbidimeters for improved low-range accuracy
- Implemented automated filter-to-waste based on turbidity spikes
- Enhanced staff training on turbidity management protocols
Results: Achieved 100% compliance with < 0.2 NTU average finished water turbidity, reduced chemical costs by 15%, and improved operational efficiency.
Future Trends
- AI-Based Process Control: Machine learning algorithms predicting turbidity and optimizing treatment
- Advanced Sensor Networks
- Membrane Technology Advancements: Lower-cost, more durable membranes
- Climate Adaptation: Resilient designs for extreme weather events