


Turbidity measures light scattering by suspended particles, while TSS measures the actual weight of those particles. They are related but not directly convertible - the relationship depends on particle characteristics, composition, and size distribution.
Core Definitions Comparison
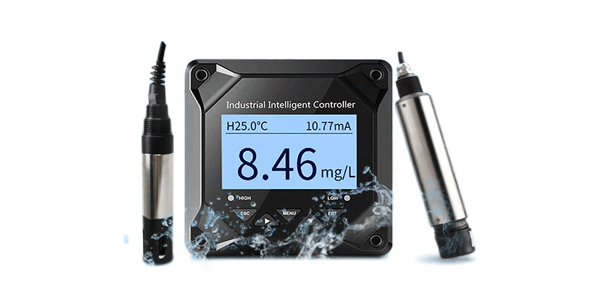
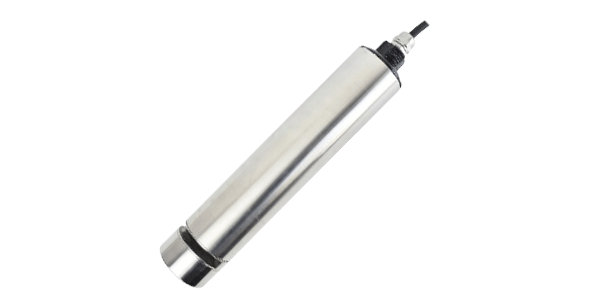
Turbidity
Definition: Optical property that causes light to be scattered and absorbed rather than transmitted through water
Units: NTU (Nephelometric Turbidity Units), FNU, FTU
Measurement: Optical instrument (nephelometer)
Key Feature: Measures light scattering effect
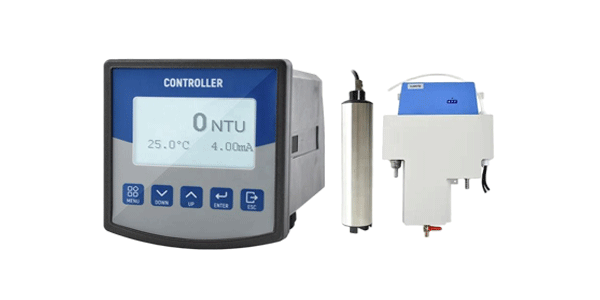
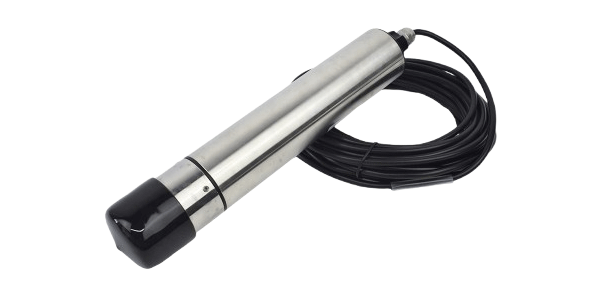
Total Suspended Solids (TSS)
Definition: Dry-weight of particles retained on a filter of specified pore size
Units: mg/L, g/m³
Measurement: Gravimetric analysis (filtering, drying, weighing)
Key Feature: Measures actual particle mass
The Correlation Relationship
The relationship between turbidity and TSS is not linear but follows a general correlation that varies based on water source and particle characteristics.
Factors Affecting Correlation
Particle Size
Smaller particles scatter more light per unit mass, increasing turbidity relative to TSS.
Particle Shape
Irregular shapes scatter light differently than spherical particles.
Particle Color
Dark particles absorb more light, reducing turbidity readings.
Particle Composition
Clay vs. organic matter vs. algae - each has different optical properties.
Never assume a fixed conversion factor between turbidity and TSS. Site-specific correlation must be established through parallel measurements. Using generic conversion factors can lead to errors up to 300%.
Conversion Formulas & Guidelines
General Conversion Formula
Where k is the correlation factor that must be determined empirically for each water source.
Typical Correlation Factors by Water Type
| Water Type | Typical k Factor | Range | R² Value | Reliability |
|---|---|---|---|---|
| Drinking Water | 0.8 - 1.2 | 0.6 - 1.5 | 0.85 - 0.95 | High |
| River Water | 1.5 - 2.5 | 1.0 - 4.0 | 0.70 - 0.85 | Medium |
| Lake Water | 1.2 - 2.0 | 0.8 - 3.0 | 0.65 - 0.80 | Medium |
| Wastewater | 2.0 - 3.5 | 1.5 - 5.0 | 0.60 - 0.75 | Low |
| Stormwater | 2.5 - 4.0 | 2.0 - 6.0 | 0.55 - 0.70 | Low |
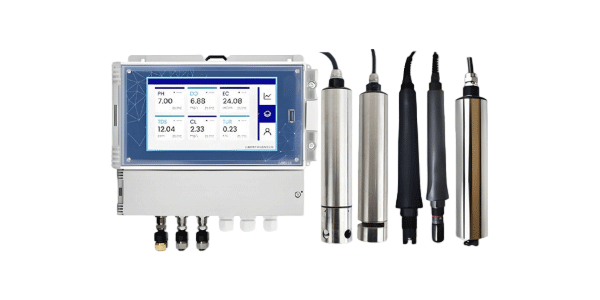
Measurement Method Comparison
| Aspect | Turbidity Measurement | TSS Measurement |
|---|---|---|
| Time Required | Seconds to minutes | Hours (filtering + drying) |
| Cost per Sample | Low ($1-5) | High ($20-50) |
| Equipment Needed | Turbidimeter | Filters, oven, balance, glassware |
| Real-time Capability | Yes (continuous monitoring) | No (laboratory analysis) |
| Regulatory Acceptance | For process control | For compliance reporting |
| Operator Skill | Low to moderate | High (trained technician) |
Best Practices for Correlation
- Parallel Sampling: Collect turbidity and TSS samples simultaneously
- Adequate Data Points: Minimum 20-30 paired measurements for reliable correlation
- Seasonal Variation: Establish correlations for different seasons
- Flow Conditions: Account for high vs low flow periods
- Statistical Analysis: Use linear regression with R² > 0.7 for acceptance
- Regular Re-evaluation: Update correlation annually or when conditions change
Need Professional Correlation Analysis?
Our certified water quality experts can help establish reliable turbidity-TSS correlations for your specific application.
Request Consultation