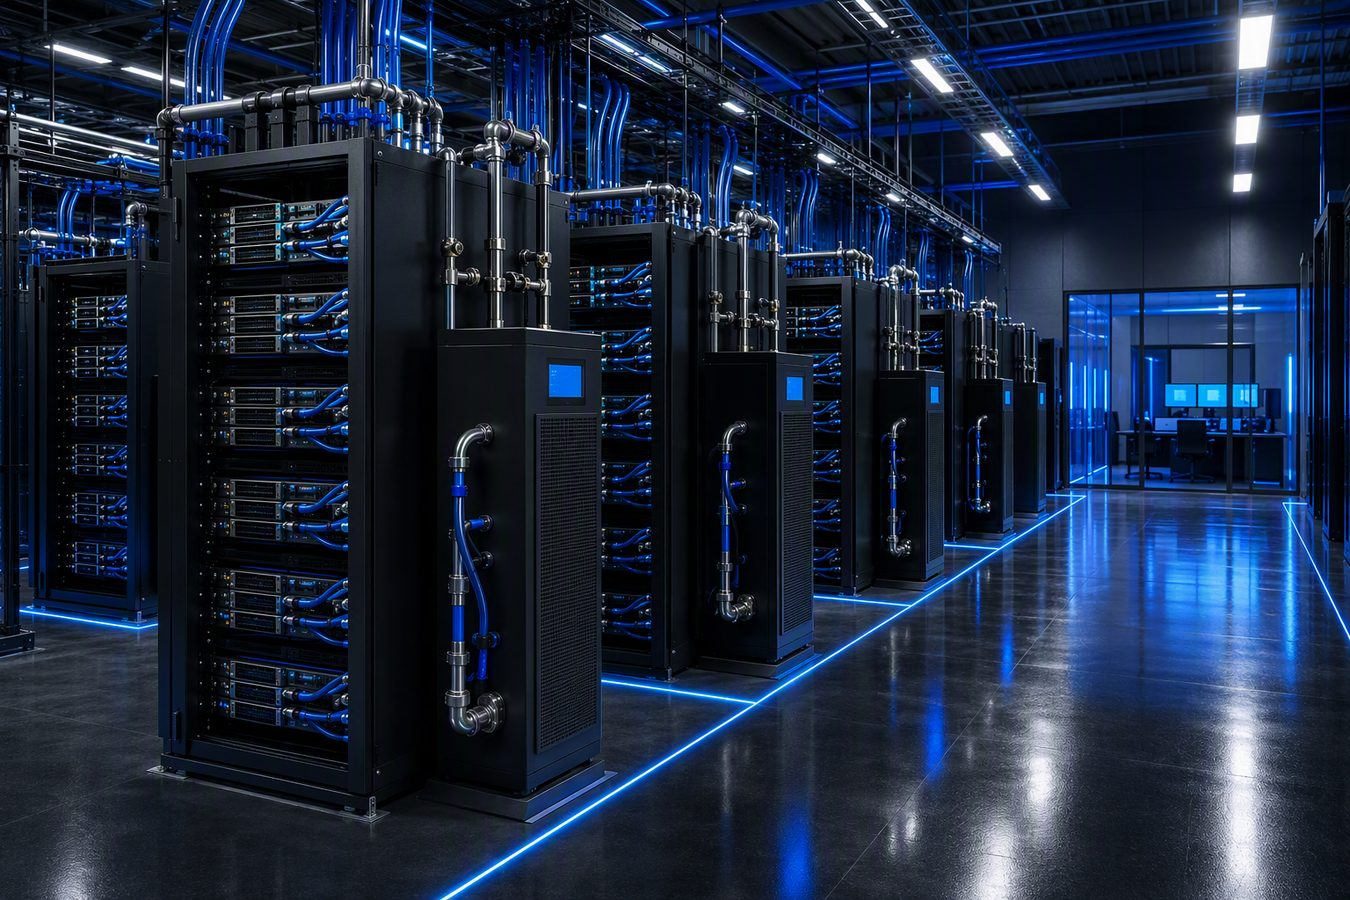
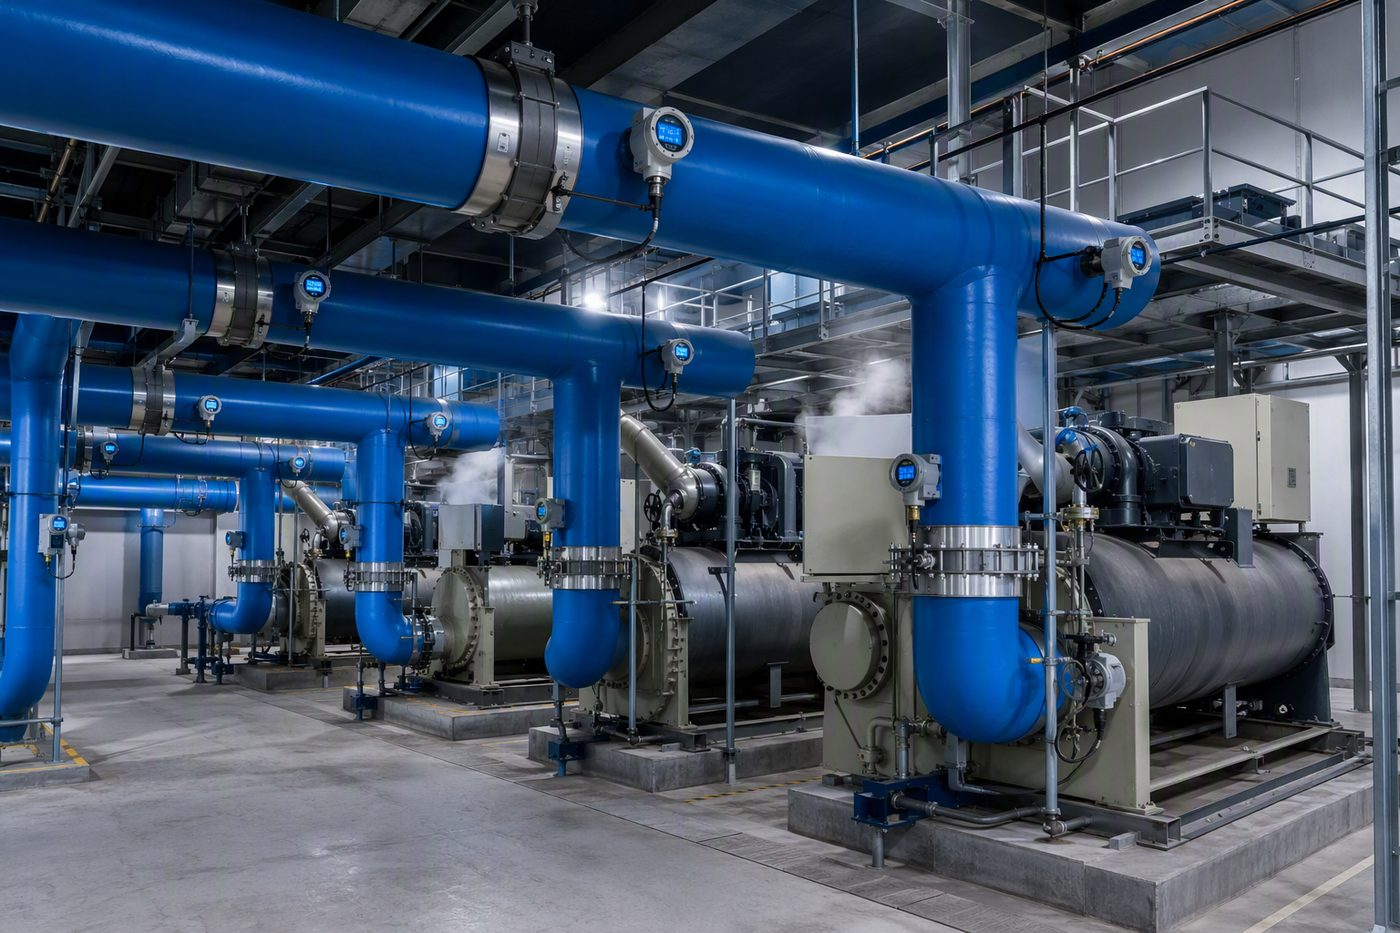
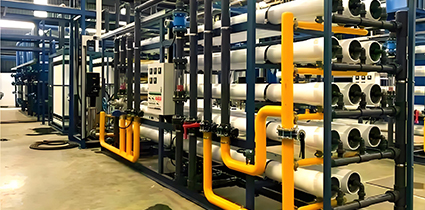
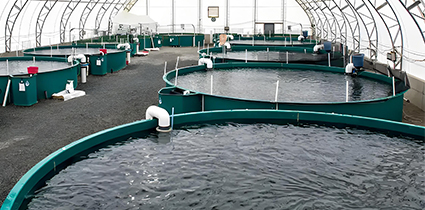
AI training workloads have made liquid cooling the mainstream thermal path for AI computing centers. GPU racks now reach 46 kW-class power density (e.g. Huawei Atlas liquid-cooled cabinets): deionized water or glycol-water coolant is distributed through a CDU to server cold plates, then circulated through the chiller plant for heat rejection.
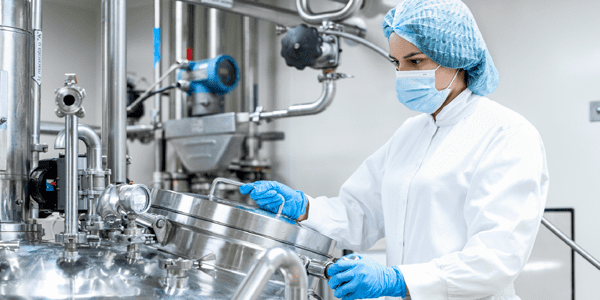
Figure 1 · Liquid-cooled GPU clusters in an AI computing center
The safety lifeline of a liquid-cooling system is the coolant itself:
Rising conductivity signals ionic contamination and corrosion risk inside the loop;
pH drift accelerates scaling and attacks wetted materials;
Flow imbalance and differential-temperature drift are the earliest signs of leaks and pump degradation.
These early signals are invisible to manual sampling and lab tests — by the time a lab result comes back, the damage is already inside the servers. This solution builds a three-tier monitoring chain — CDU loop → chiller plant → cooling tower — with continuous online measurement of supply/return coolant temperature and ΔT, loop flow, conductivity and pH. Data is integrated into DCIM via 4-20mA / RS485 and pushed to the cloud, enabling ahead-of-failure warnings for leaks and corrosion plus cooling-energy metering for PUE accounting: turning liquid cooling from fix-after-failure into data-driven prevention.
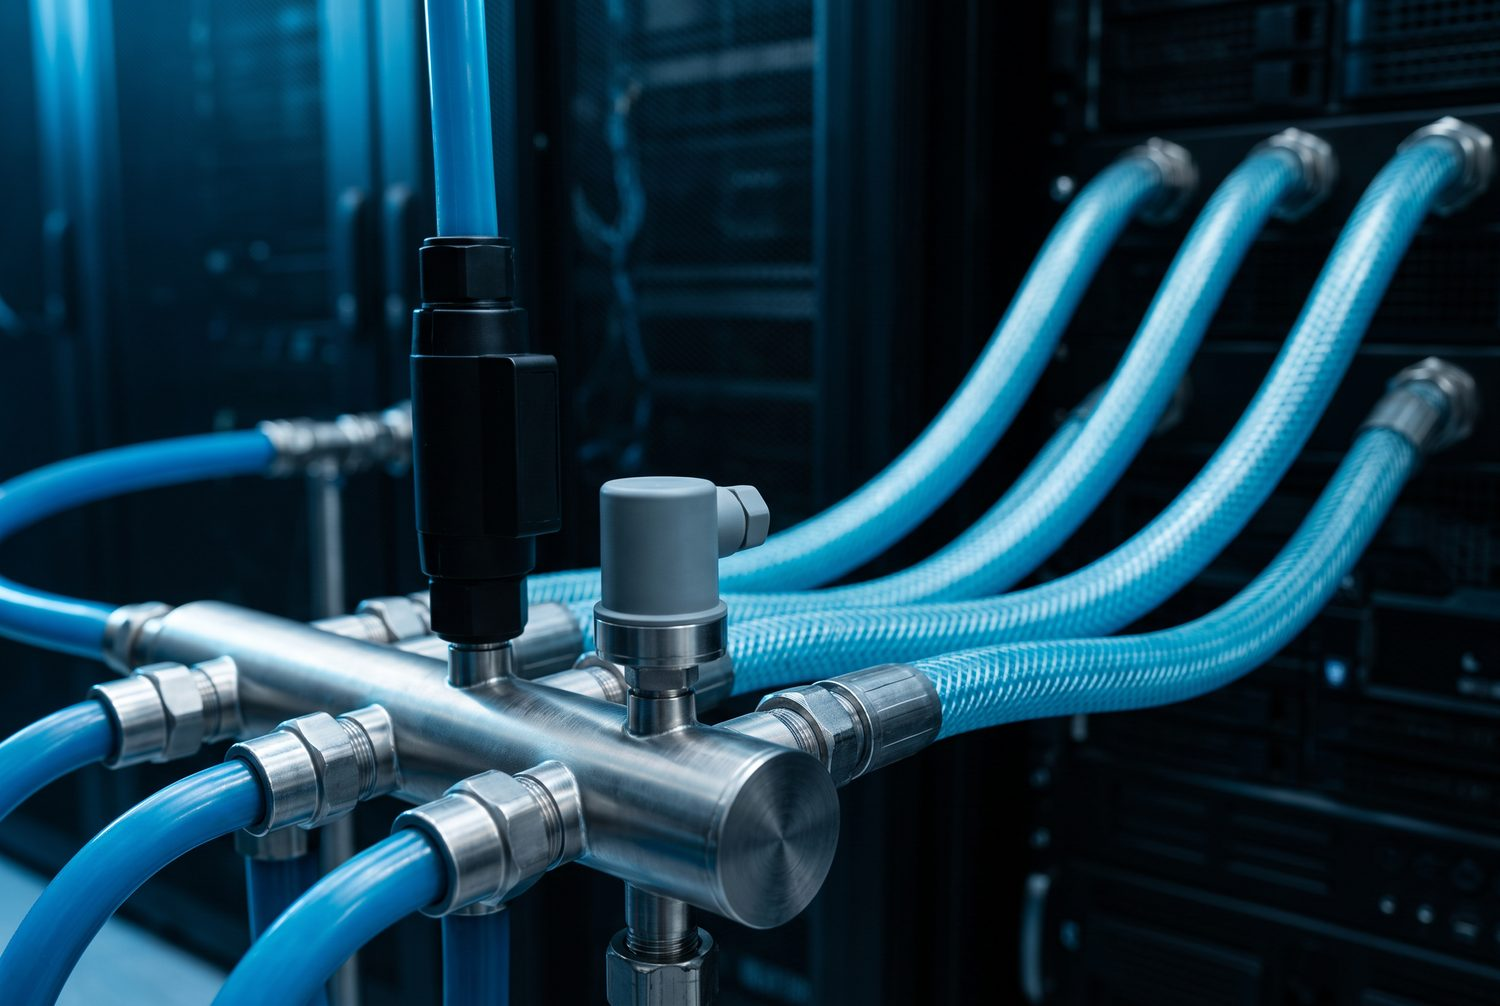
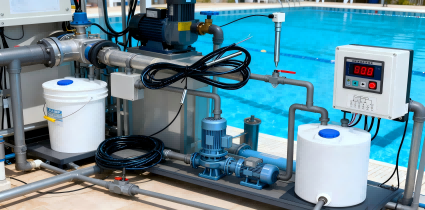
Figure 2 · CDU coolant distribution loop
Section 02
Industry Pain Points
#1 risk: uncontrolled coolant conductivity / pH
Once ionic contamination and corrosion reach the servers, losses are counted in hours. Yet the industry still relies on periodic lab sampling — low coverage, late discovery.
Invisible early failures
CDU branch flow imbalance, pump degradation and micro-leaks at hose joints first show up as slight flow drop and ΔT drift — signals a manual patrol simply cannot catch.
Generic instruments don't fit
Standard meters are not ranged for low-conductivity deionized/glycol coolant; temperature, flow and water quality often come from different vendors with fragmented interfaces.
No cooling-energy data, no PUE
Without chilled-water ΔT and flow, there is no credible cooling-capacity metering — PUE accounting, system acceptance and incident tracing all lack evidence.
Liquid cooling is a data-intensive system: without continuous monitoring, it runs blind.
Section 03
Overall Monitoring Solution
Five-layer architecture
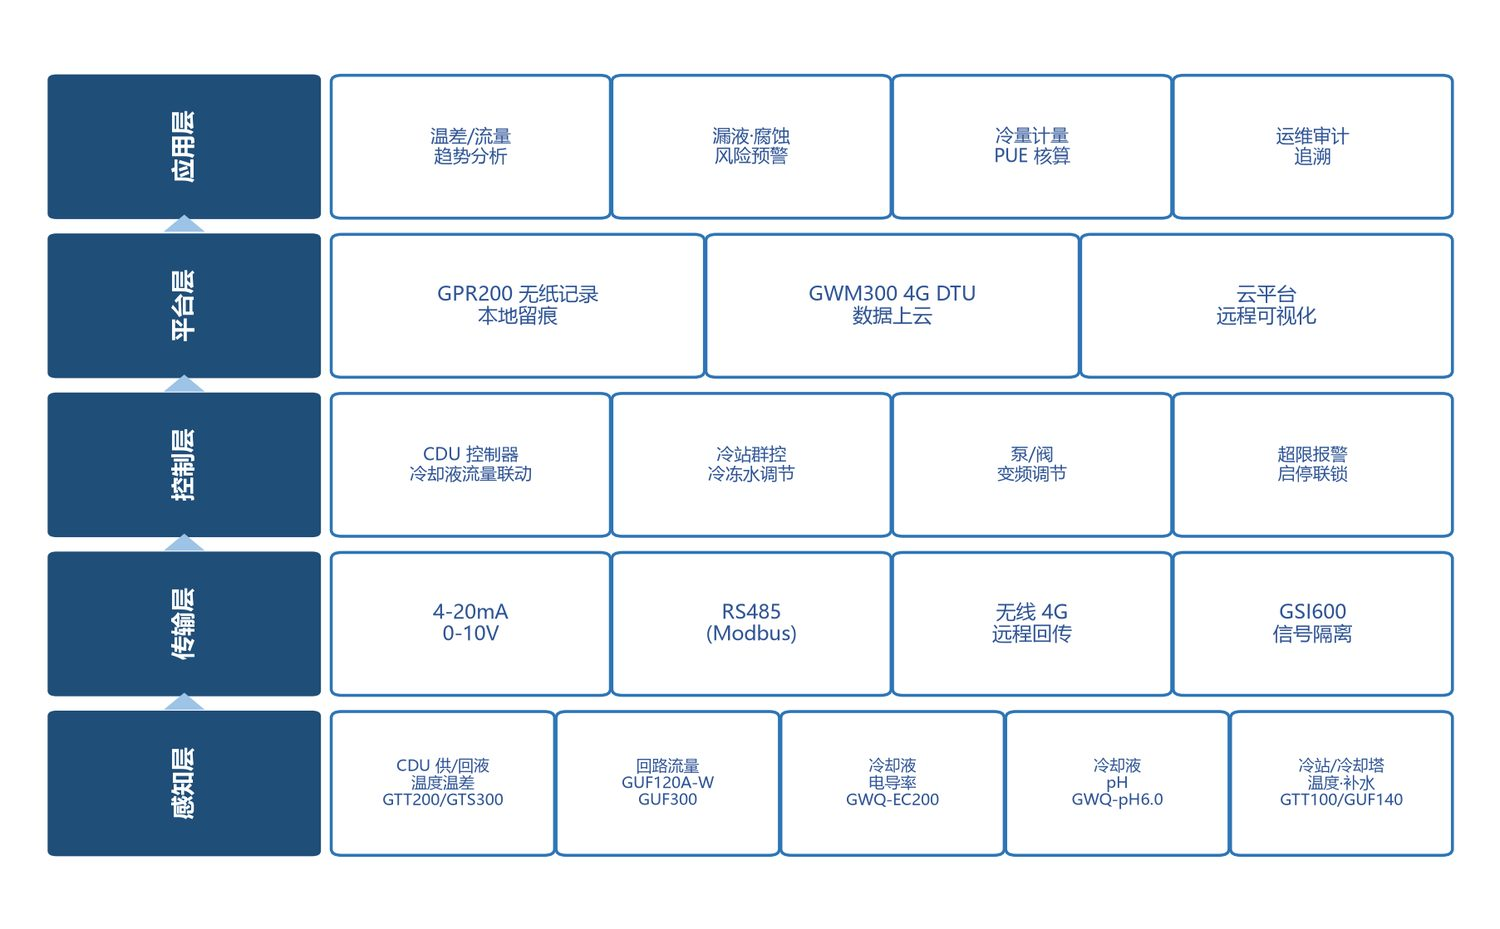
The solution follows the GAIMC closed loop of real-time monitoring → linked control → automatic alarm → remote visualization → data traceability, deployed in five layers:
Supply-return ΔT — the core heat-removal efficiency indicator
Loop / branch flow
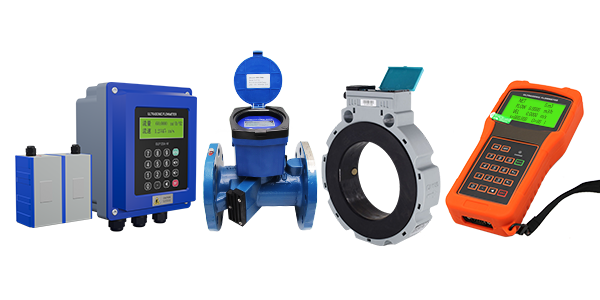
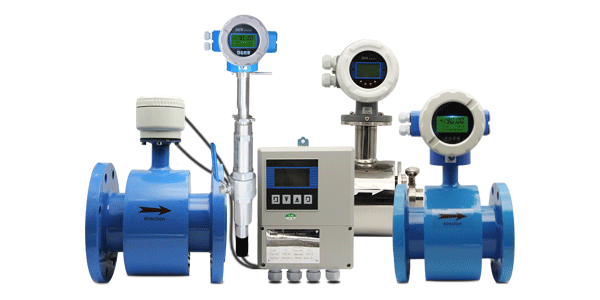
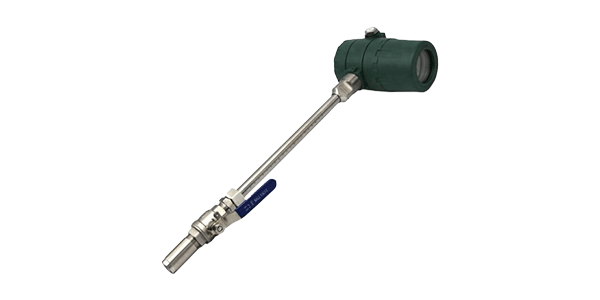
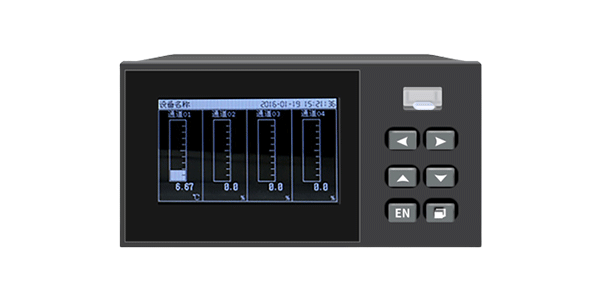
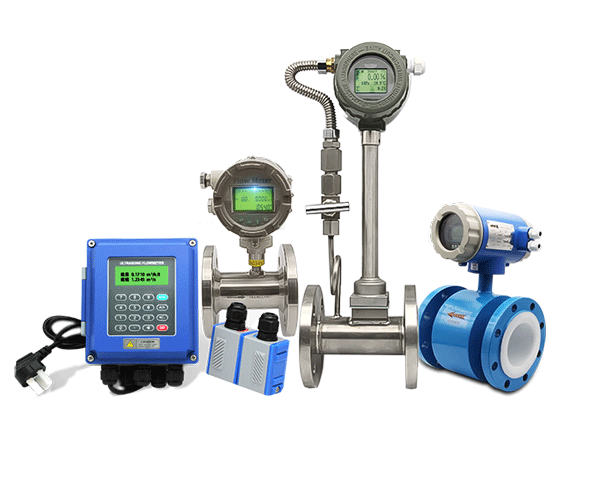
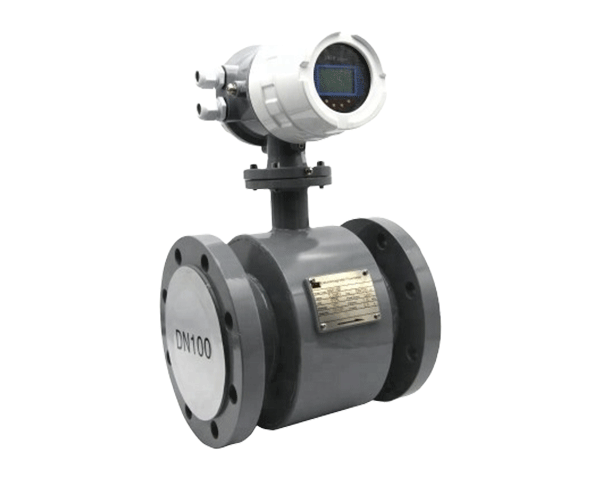
GUF120A-W · GUF300 · GMF100
Flow balance, pump degradation and leak-signature detection; cooling-energy metering input
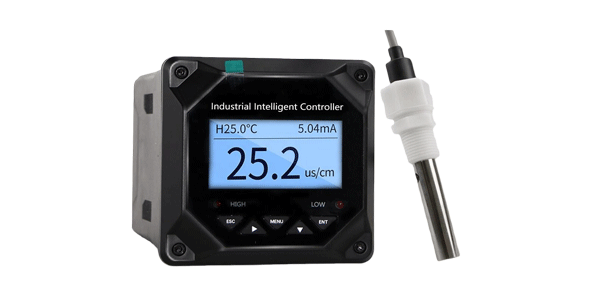
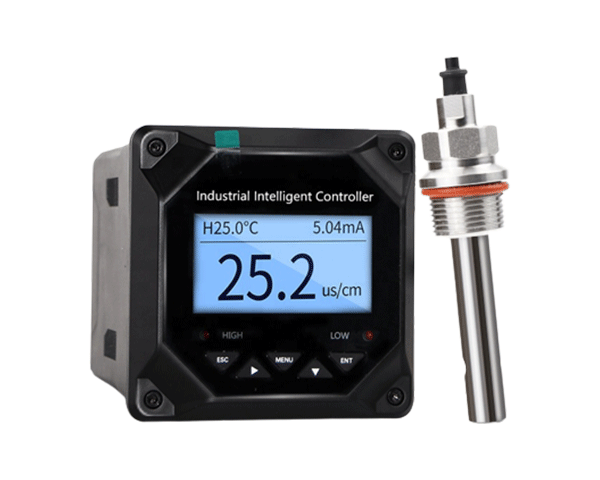
Coolant conductivity
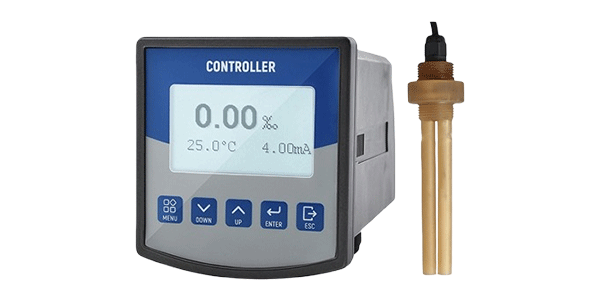
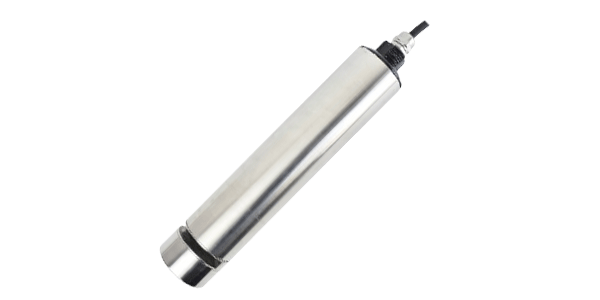
GWQ-EC200
Continuous ionic-contamination monitoring — the core anti-corrosion metric, ranged for deionized / glycol-water coolant
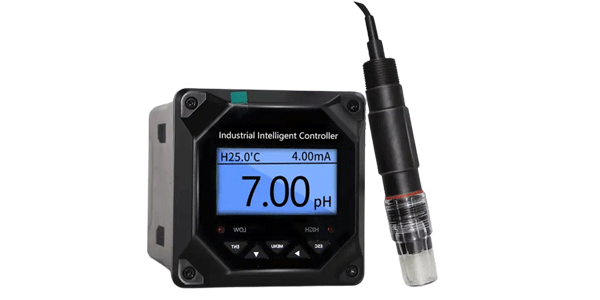
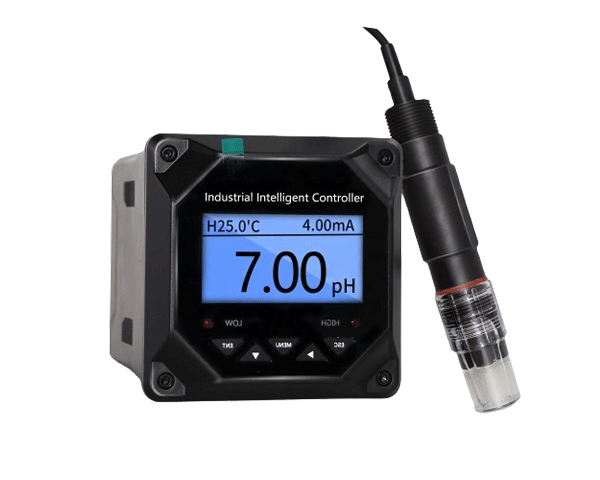
Coolant pH
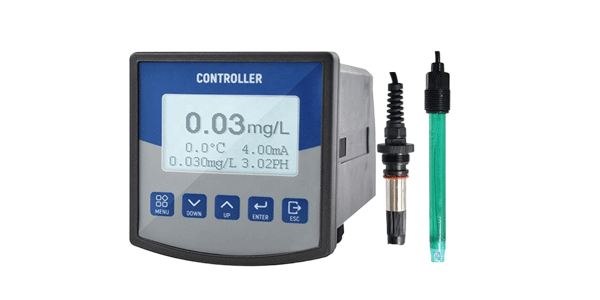
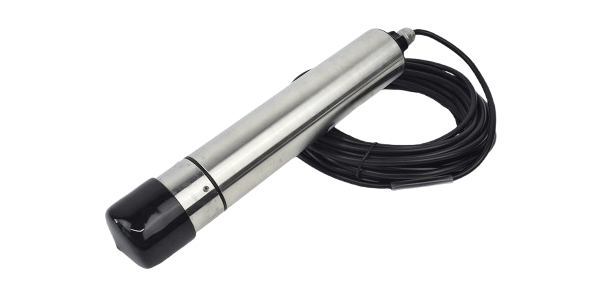
GWQ-pH6.0
Acidity/alkalinity trend — early corrosion warning
Make-up water
GUF140
Coolant life and indirect leak judgment
Chiller plant chilled water
GTT100 · GUF120A-W / GMF100
Precise cooling-energy metering for PUE; early warning of chiller efficiency decay and pump faults
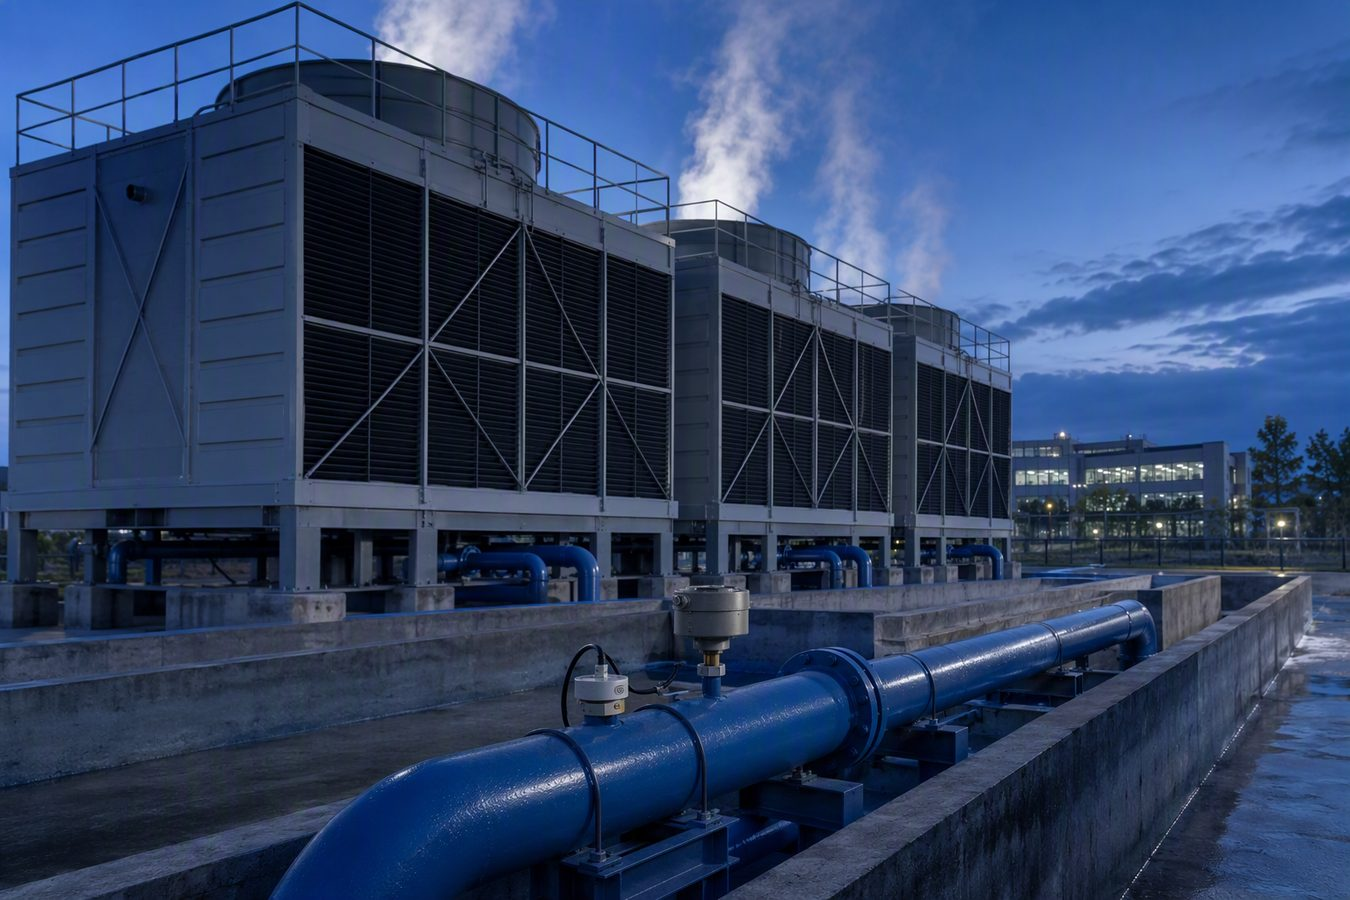
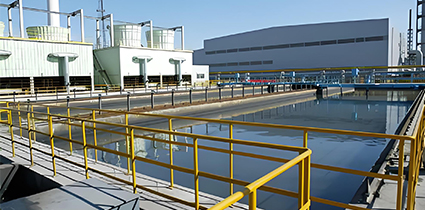
Cooling tower / outdoor
GTT210S · GUF140
Ambient temperature and make-up metering — heat-rejection efficiency and water savings
Typical application scenarios
Liquid-cooling CDU loop
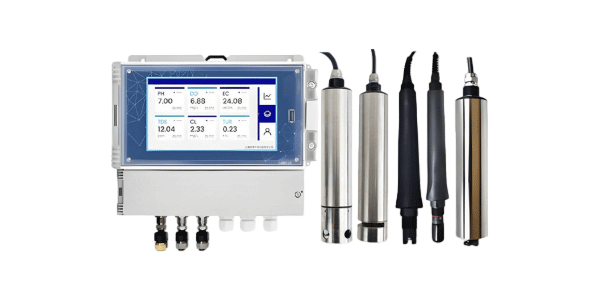
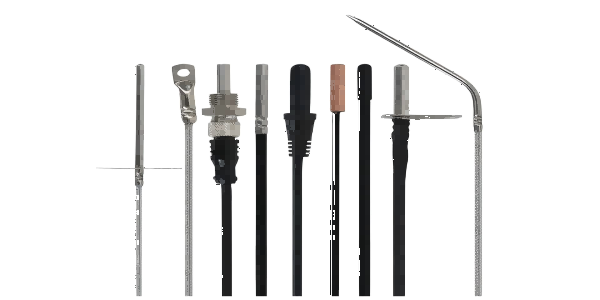
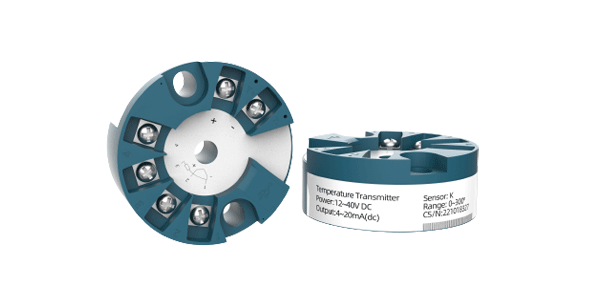
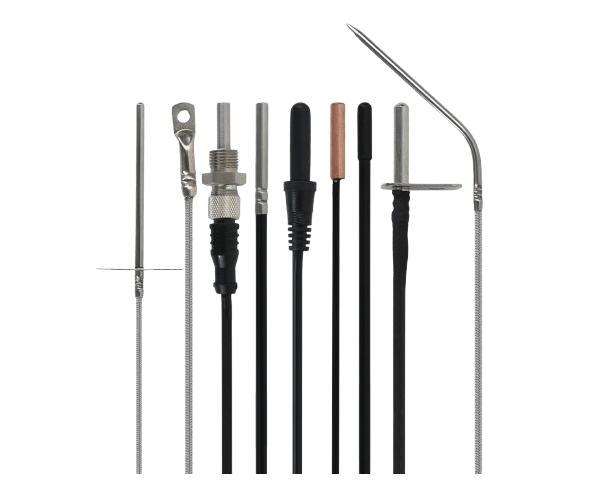
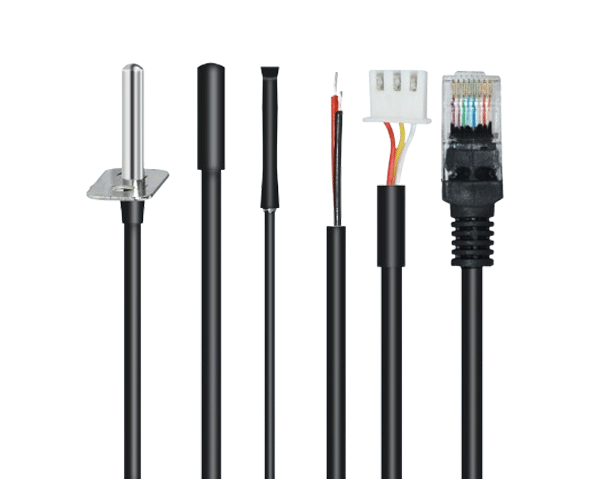
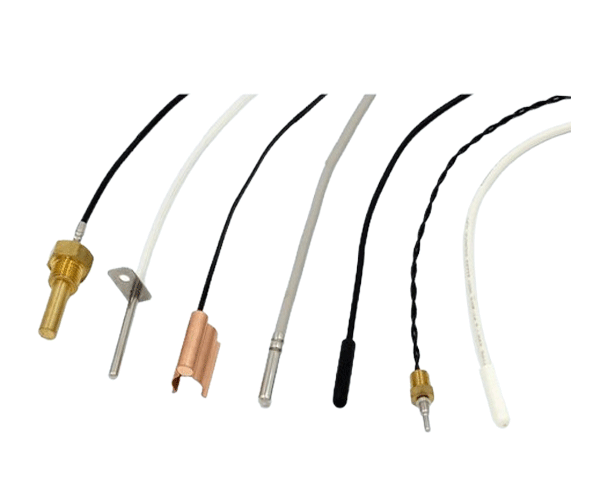
GTT200 / GTS300 (supply-return temperature), GUF120A-W / GUF300 (loop flow), GWQ-EC200 (conductivity), GWQ-pH6.0 (pH) — ΔT, flow and water quality monitored together for ahead-of-failure leak and corrosion warnings protecting cold plates and piping.
Chiller plant / heat source
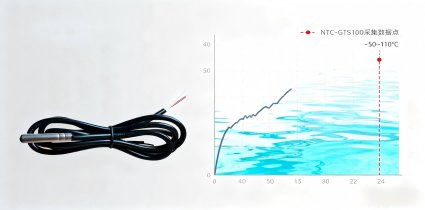
GTT100 / GTT200 (supply-return water temperature), GUF120A-W / GMF100 (chilled-water flow) — precise cooling-energy metering for PUE accounting and early warning of chiller and pump degradation.
Cooling tower / outdoor heat rejection
GTT210S (outdoor temperature), GUF140 (make-up water metering) — make-up volume and heat-rejection efficiency in real time, supporting water-saving management.
Retrofit & remote sites
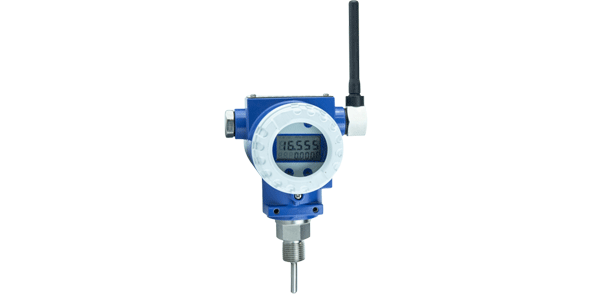
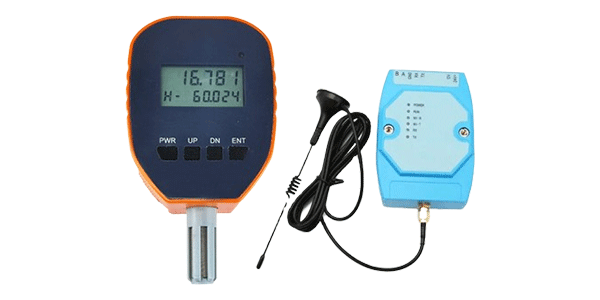
GUF300 clamp-on flow (no pipe cutting), GTT270 wireless temperature, GWM300 (4G to cloud) — add monitoring without touching the piping; ideal for live systems and remote stations.
Ionic contamination — the core anti-corrosion indicator
pH
Coolant loop
Corrosion-trend early warning
Make-up volume
Make-up line
Coolant life and indirect leak judgment
Together they form a complete monitoring chain covering the CDU loop, the chiller plant and the cooling tower.
Why this combination wins
1
Purpose-built liquid-cooling set. Temperature + flow + conductivity/pH delivered as one matched package from a single vendor — no fragmented interfaces.
2
Ranged for real coolant. GWQ-EC200 covers the low-conductivity range of deionized and glycol-water coolant that generic meters miss.
3
Maintenance-free principles. Ultrasonic / electromagnetic sensing with no moving parts runs 7×24 without wear.
4
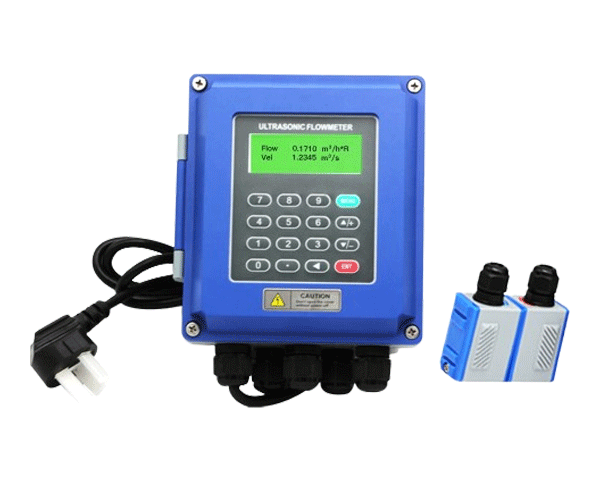
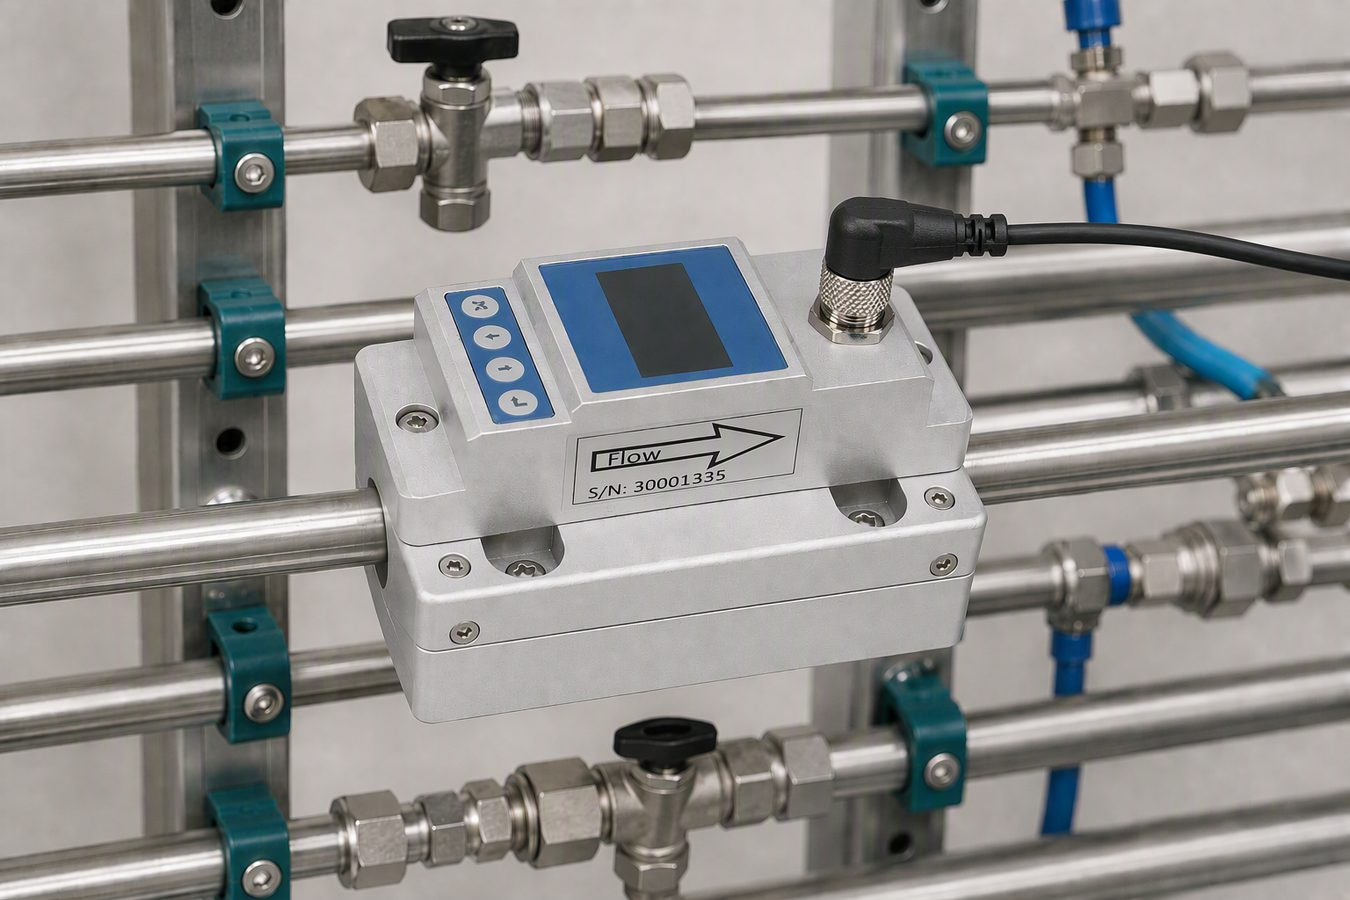
Clamp-on retrofit. GUF300 installs without cutting pipes — live systems get monitoring with zero downtime.
5
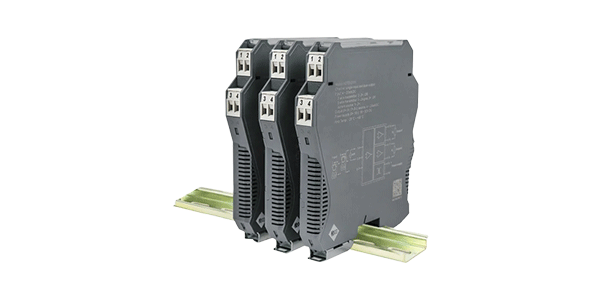
Full-chain data path. GPR200 local retention, GSI600 isolation, 4-20mA / RS485 to DCIM, GWM300 4G to cloud — one consistent interface set.
Bottom-line benefits
Safety — continuous conductivity / pH online, corrosion and leaks flagged before they reach the servers.
Precision — loop-level correlated data (ΔT + flow + water quality) surfaces anomalies earlier.
Energy — cooling-energy metering grounds PUE accounting and optimization.
Compliance — water-quality and flow records support acceptance, audit and incident tracing.
Figure 6 · GUF300 clamp-on installation — no pipe cutting
Section 05
Summary
Liquid-cooled AI computing centers live or die by coolant condition and loop hydraulics. The GAIMC solution watches all of it continuously — temperature/ΔT, flow, conductivity, pH and make-up volume across the CDU loop, chiller plant and cooling tower — feeds DCIM through standard 4-20mA / RS485 signals, and pushes everything to the cloud for trend analysis, leak and corrosion early warning, and PUE-grade cooling-energy metering.
One vendor, one matched instrument set, one data path — turning liquid-cooling operations from reactive repair into data-driven prevention.
FAQ
Frequently Asked Questions
Why is coolant conductivity the number-one risk in liquid cooling?
Conductivity rise means ionic contamination, which drives galvanic corrosion inside cold plates and micro-channels. Once corrosion products reach the servers, losses are counted in hours of downtime. Continuous conductivity monitoring catches the trend days or weeks before lab sampling would.
Can we add monitoring without shutting the loop down or cutting pipes?
Yes. The GUF300 is a clamp-on ultrasonic flow meter that installs on the pipe exterior with no pipe cutting and no downtime — ideal for live AI computing centers. The GTT270 adds wireless temperature points the same way.
How does the solution support PUE calculation?
Chilled-water supply/return temperature (GTT100/GTT200) combined with flow (GUF120A-W/GMF100) yields precise cooling-energy metering. With IT load from the DCIM, PUE becomes measurable, trendable and verifiable — also supporting system acceptance and audit.
Our coolant is deionized water with very low conductivity. Do standard meters work?
Generic conductivity meters are usually ranged too high for deionized or glycol-water coolant. The GWQ-EC200 is purpose-ranged for low-conductivity coolant, which is exactly the condition liquid-cooling loops run in.
How does the data get into our DCIM or building management system?
Instruments output 4-20mA, 0-10V or RS485 Modbus, isolated through GSI600 modules, and integrate directly with DCIM and chiller-plant control. Where wiring is impractical, the GWM300 4G DTU uploads to the GAIMC cloud for remote visualization and alarm push.
Does this apply to immersion cooling as well as cold plates?
Yes. The monitoring chain — ΔT, flow, conductivity and pH on the coolant loop, plus plant-side energy metering — applies to both cold-plate and immersion architectures; only the sensor points differ per loop design.